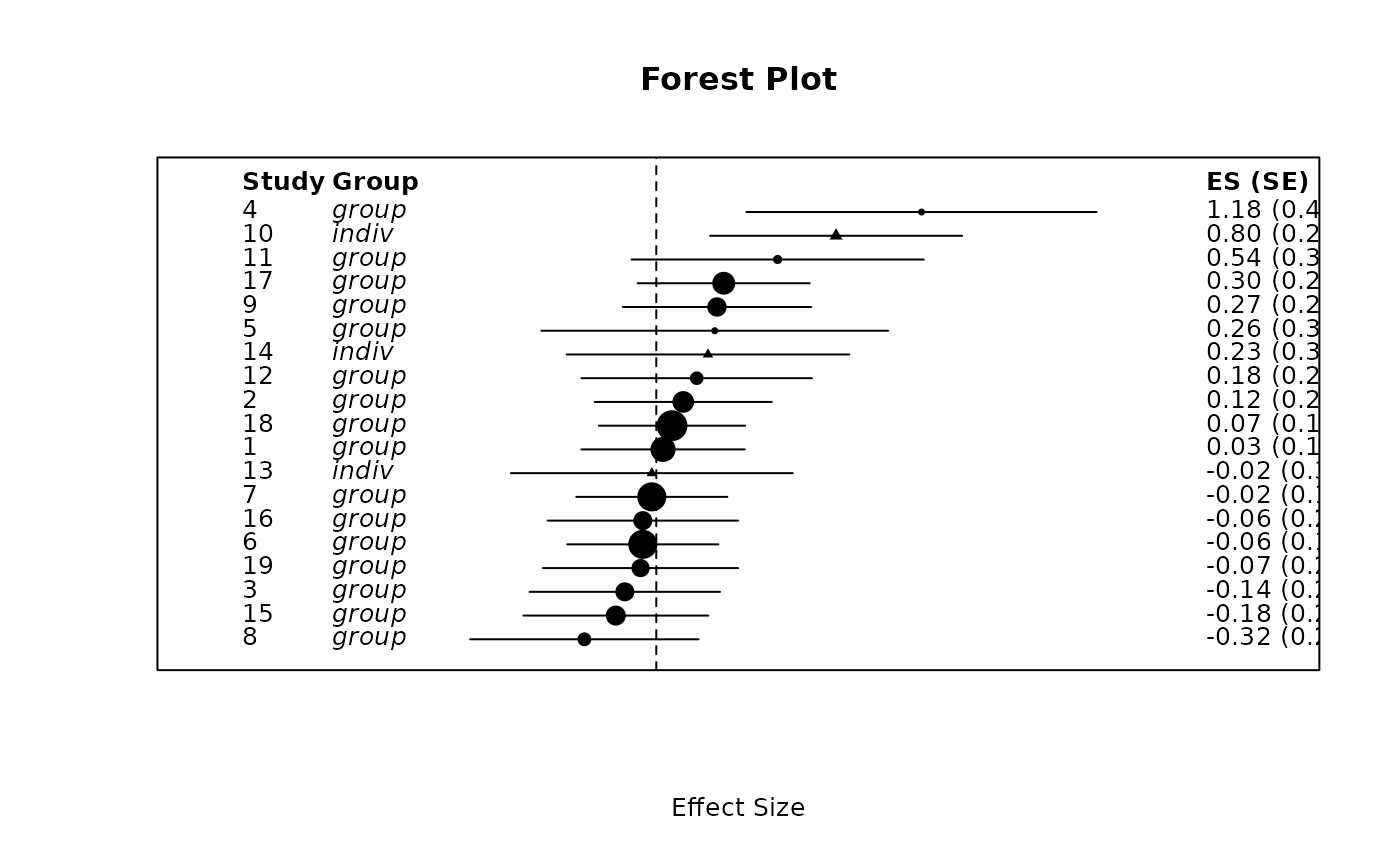
Forest Plot for Meta-Analysis Results
forest_plot.RdGenerates a forest plot from a meta-analysis result object, optionally grouped by a specified subgrouping variable.
Usage
forest_plot(
  mars_object,
  subgroups = NULL,
  z_dist = TRUE,
  xlab = "Effect Size",
  main = "Forest Plot",
  study_header = "Study",
  subgroup_header = "Group",
  es_header = "ES (SE)",
  note = NULL,
  ci_level = 0.95,
  marker_scale = 2,
  font_cex = 0.8,
  legend_position = "top",
  legend_title = NULL,
  legend_inset = c(0, -0.2),
  main_adj = 0.5,
  main_line = NULL
)
Arguments
- mars_object
A fitted mars object.
- subgroups
Optional. Name of the column in
mars_object$datato use as subgroup variable.- z_dist
Logical. Whether to use the normal distribution for confidence intervals. If
FALSE, uses the t-distribution.- xlab
Label for the x-axis. Defaults to "Effect Size".
- main
Title of the forest plot. Defaults to "Forest Plot".
- study_header
Label for the column showing study names. Defaults to "Study".
- subgroup_header
Label for the subgroup column (if used). Defaults to "Group".
- es_header
Label for the effect size column. Defaults to "ES (SE)".
- note
Optional. Text or named list providing a summary note (for example, effect, SE, tau^2, I^2).
- ci_level
Confidence level for the interval bounds. Defaults to 0.95.
- marker_scale
Numeric multiplier for marker size. Defaults to 2.
- font_cex
Numeric scaling for text labels. Defaults to 0.8.
- legend_position
Legend position for subgroup labels. Use
"none"to hide.- legend_title
Optional subgroup legend title.
- legend_inset
Numeric inset passed to
legend.- main_adj
Horizontal title alignment in
[0, 1].- main_line
Optional title line. If
NULL, default is used.
Details
The function sorts studies by effect size and draws each study as a point with a confidence interval.
If subgroups is provided, distinct plot symbols are used for each group and a legend is added.
Optionally, a summary note can be added below the plot using the note argument.
Examples
# \donttest{
fit <- mars(
  data = teacher_expectancy,
  studyID = "study",
  effectID = NULL,
  sample_size = NULL,
  formula = yi ~ 1,
  variance = "vi",
  varcov_type = "univariate",
  structure = "univariate"
)
forest_plot(fit, subgroups = "setting")

# }
# }