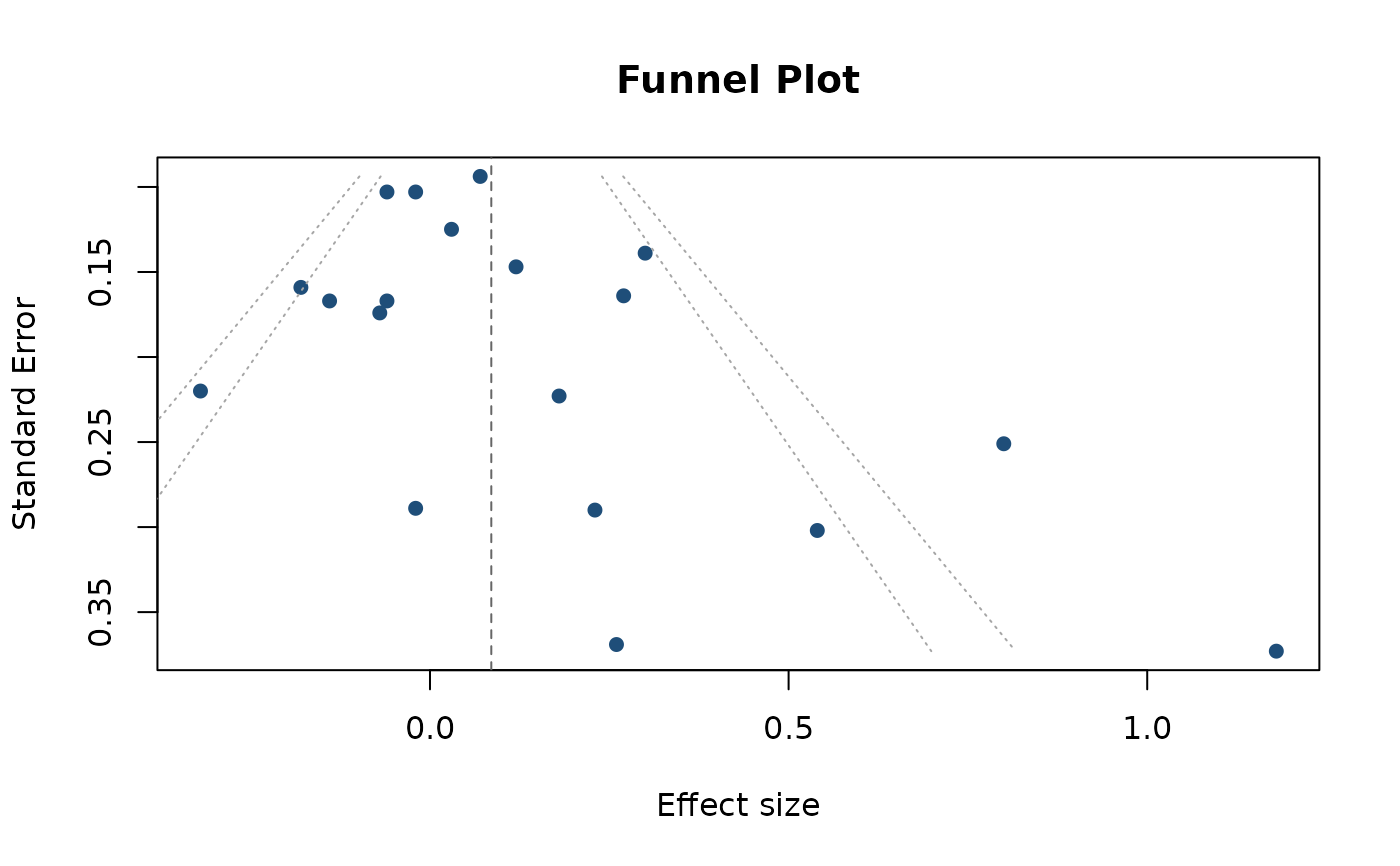
Funnel Plot for Publication-Bias Models
funnel_plot.RdDraws a funnel plot from a fitted pub_bias object.
Usage
funnel_plot(object, ...)

# S3 method for class 'pub_bias'
funnel_plot(
  object,
  y_axis = c("se", "precision"),
  center = c("adjusted", "observed", "none"),
  show_contours = TRUE,
  contour_levels = c(0.9, 0.95),
  point_cex = 0.9,
  point_col = "#1F4E79",
  xlab = "Effect size",
  ylab = NULL,
  main = "Funnel Plot",
  center_line_col = "gray40",
  contour_col = "gray65",
  main_adj = 0.5,
  main_line = NULL,
  ...
)
Arguments
- object
A fitted object returned by
publication_bias.- ...
Additional arguments passed to
plot.- y_axis
One of
"se"(standard error, default) or"precision".- center
Which center line to draw. One of
"adjusted","observed", or"none".- show_contours
Logical; if
TRUE, adds pseudo confidence contours.- contour_levels
Numeric vector of contour levels (e.g.,
c(0.90, 0.95)).- point_cex
Point size scaling.
- point_col
Point color.
- xlab
Label for x-axis.
- ylab
Optional y-axis label. If
NULL, chosen fromy_axis.- main
Plot title.
- center_line_col
Center-line color.
- contour_col
Contour-line color.
- main_adj
Horizontal title alignment in
[0, 1].- main_line
Optional title line. If
NULL, default is used.
Examples
# \donttest{
fit <- mars(
  data = teacher_expectancy,
  studyID = "study",
  effectID = NULL,
  sample_size = NULL,
  formula = yi ~ 1,
  variance = "vi",
  varcov_type = "univariate",
  structure = "univariate"
)
bias_fit <- publication_bias(fit)
funnel_plot(bias_fit)

# }
# }