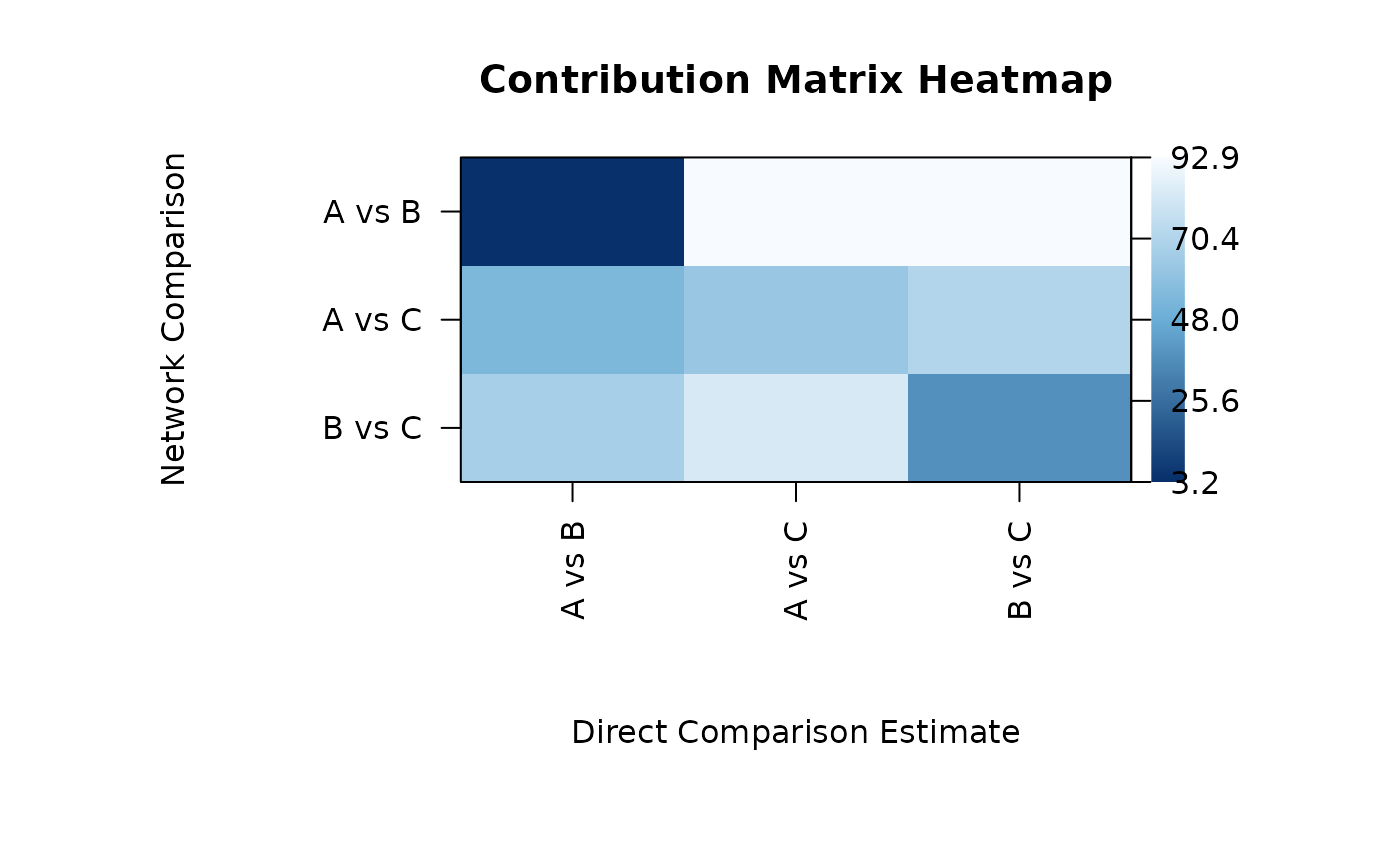
Heatmap for Network Contribution Matrix
network_contribution_heatmap.RdDraws a base R heatmap from the contribution_matrix stored in a fitted
network_meta object.
Usage
network_contribution_heatmap(
  nma_object,
  main = "Contribution Matrix Heatmap",
  xlab = "Direct Comparison Estimate",
  ylab = "Network Comparison",
  low = "#F7FBFF",
  mid = "#6BAED6",
  high = "#08306B",
  n_colors = 100,
  show_values = FALSE,
  value_digits = 1,
  value_cex = 0.6,
  text_col = "#111111",
  show_legend = TRUE,
  legend_side = c("right", "left"),
  legend_title = NULL,
  main_adj = 0.5,
  main_line = NULL
)
Arguments
- nma_object
A fitted object returned by
network_meta.- main
Plot title.
- xlab
Label for the x-axis.
- ylab
Label for the y-axis.
- low
Color for low contributions.
- mid
Color for mid contributions.
- high
Color for high contributions.
- n_colors
Number of colors in the gradient.
- show_values
Logical; if
TRUE, cell percentages are printed.- value_digits
Digits for printed percentages.
- value_cex
Text size for printed percentages.
- text_col
Color for printed values.
- show_legend
Logical; if
TRUE, draws the heatmap color legend.- legend_side
Side for the color legend:
"right"or"left".- legend_title
Title for the heatmap color legend.
- main_adj
Horizontal title alignment in
[0, 1].- main_line
Optional title line. If
NULL, default is used.