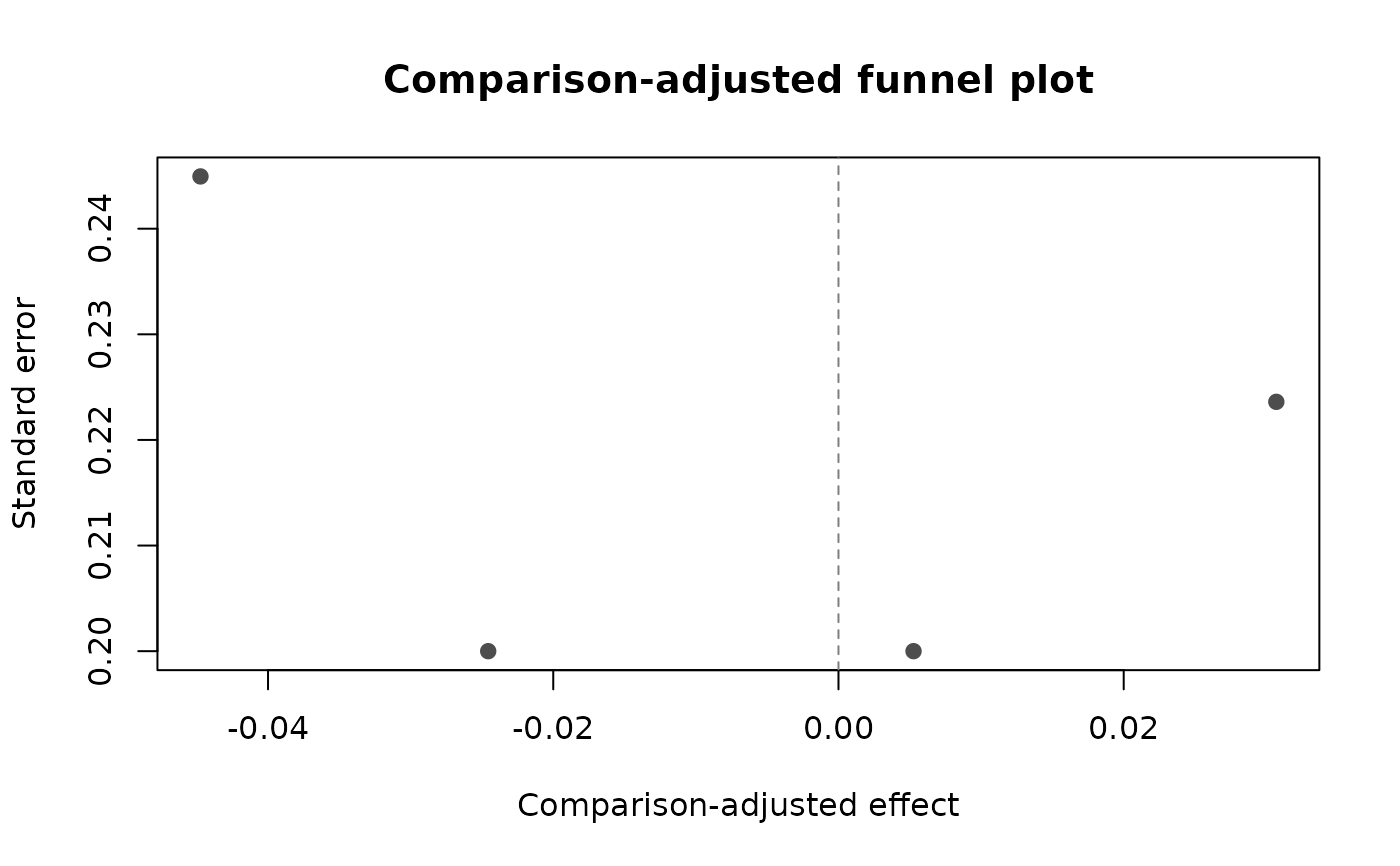
Comparison-adjusted funnel plot for network meta-analysis
network_funnel_plot.RdComparison-adjusted funnel plot for network meta-analysis
Usage
network_funnel_plot(
  object,
  center = c("network", "direct"),
  comparison_adjusted = TRUE,
  level = 0.95,
  xlab = NULL,
  ylab = "Standard error",
  main = "Comparison-adjusted funnel plot",
  pch = 19,
  col = "gray30",
  ...
)
Arguments
- object
A fitted
nma_marsobject.- center
Center each direct comparison around
"network"total estimates or"direct"direct estimates.- comparison_adjusted
Logical; if
TRUE, subtract the chosen comparison-specific center before plotting.- level
Confidence guide level.
- xlab, ylab, main
Plot labels.
- pch, col
Point symbol and color.
- ...
Additional arguments passed to
plot.