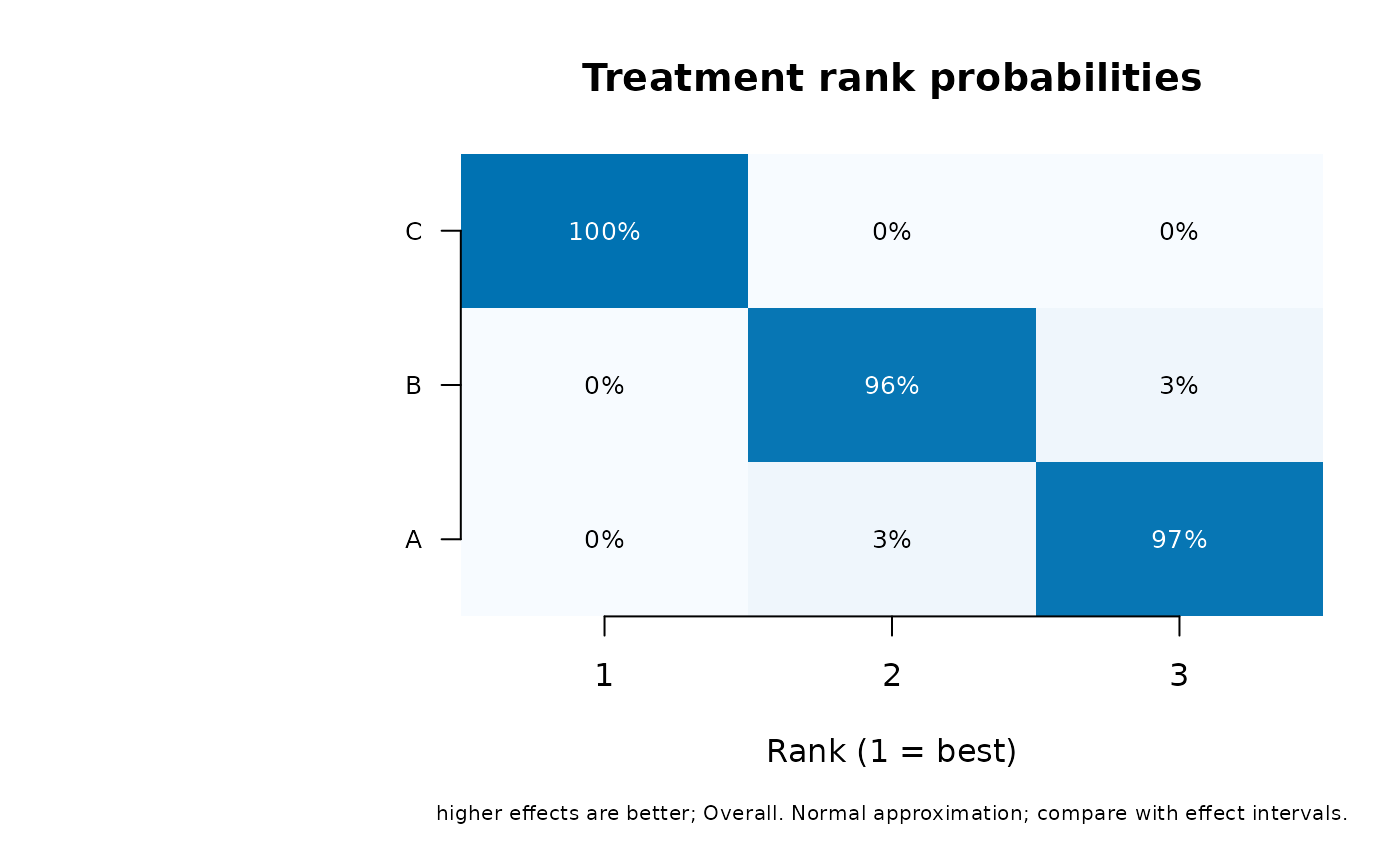
Plot the full distribution of network treatment ranks
network_rank_plot.RdPlot the full distribution of network treatment ranks
Arguments
- object
A fitted network model; for the ranking-table summary method, the
rankingsdata frame returned bynetwork_rankings().- benefit_direction
Whether
higherorlowereffects are preferable.- strata
Named outcome/time selection; exactly one stratum is required.
- nsim
Number of draws, at least 100.
- seed
Optional local seed; the caller's random-number state is restored.
- main
Plot title.
- colors
Heatmap palette; the last color is used for bar rankograms.
- type
heatmap(default) compares all treatments and ranks together;bardraws one rankogram panel per treatment with a common probability axis.- label_cex
Scaling for treatment/axis labels. Font family and style inherit base graphics settings such as
par(family="sans", font=1).- value_cex
Scaling for heatmap probability labels.
Details
Both displays use the same joint simulations and return the same ranking object. The heatmap shows rank 1 on the left, treatments ordered by mean rank (best average position first), a fixed 0–1 color scale and rounded percentage labels. Bar panels show rank on the horizontal axis and its probability on the vertical axis, with treatments in the same mean-rank order. Each panel sums to one for continuous draws without ties. A sharply concentrated distribution indicates a more certain rank under this model; a broad or multi-peaked distribution is hidden by a single SUCRA summary. These plots concern ranks of average effects, not effect magnitudes, clinical relevance or new-study predictions. Zero-percent heatmap labels can represent small nonzero probabilities after rounding.
References
Rücker, G., and Schwarzer, G. (2015). Ranking treatments in frequentist network meta-analysis works without resampling methods. BMC Medical Research Methodology, 15, 58. doi:10.1186/s12874-015-0060-8 .
Salanti, G., Ades, A. E., and Ioannidis, J. P. A. (2011). Graphical methods and numerical summaries for presenting results from multiple-treatment meta-analysis: an overview and tutorial. Journal of Clinical Epidemiology, 64, 163–171. doi:10.1016/j.jclinepi.2010.03.016 .
See also
network_rankings() for joint simulation and ranking definitions.
Examples
dat <- data.frame(study = 1:6, a = rep(c("A", "A", "B"), 2),
                  b = rep(c("B", "C", "C"), 2),
                  yi = c(.2, .5, .3, .3, .6, .4), vi = .04)
fit <- network_meta(dat, "study", "a", "b", "yi", "vi")
network_rank_plot(fit, benefit_direction = "higher", nsim = 500)