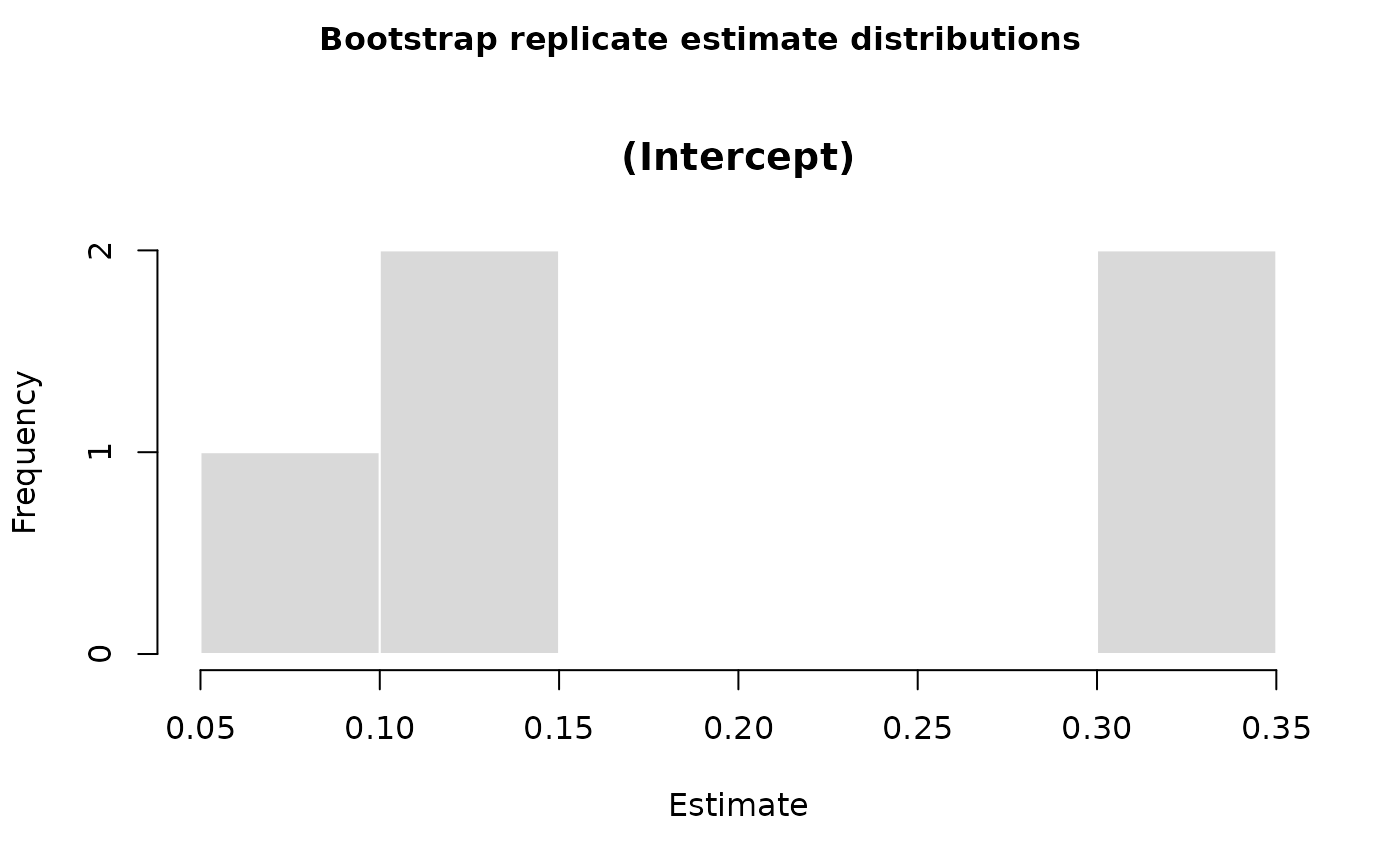
Plot alternative-estimation replications
plot.mars_boot.RdVisualize replicate estimates from bootstrap, jackknife, or permutation output on a single base R figure.
Usage
# S3 method for class 'mars_boot'
plot(
  x,
  terms = NULL,
  xlab = "Estimate",
  ylab = "Frequency",
  main = NULL,
  breaks = "Sturges",
  col = "grey85",
  border = "white",
  panel_layout = NULL,
  ...
)
Arguments
- x
A
"mars_boot"object created bycompute_alt_stats().- terms
Optional character vector of terms to plot. Defaults to the fixed effect terms stored in the model summary when available, otherwise all replicated terms.
- xlab
Label for the x-axis.
- ylab
Label for the y-axis.
- main
Optional plot title. If
NULL, a title is generated from the alternative-estimation type.- breaks
Histogram breaks passed to
hist().- col
Fill color for the histograms.
- border
Border color for the histograms.
- panel_layout
Optional length-2 numeric vector giving the
mfrowpanel layout. By default a near-square layout is chosen.- ...
Additional arguments passed to the underlying base plotting call.
Examples
# \donttest{
boot_reps <- replicate_bootstrap(
  number_bootstraps = 5,
  data = teacher_expectancy,
  studyID = "study",
  effectID = NULL,
  sample_size = NULL,
  formula = yi ~ 1,
  variance = "vi",
  varcov_type = "univariate",
  structure = "univariate"
)
boot_stats <- compute_alt_stats(boot_reps)
plot(boot_stats, terms = "(Intercept)")

# }
# }