Plot residual diagnostics panels for MARS models
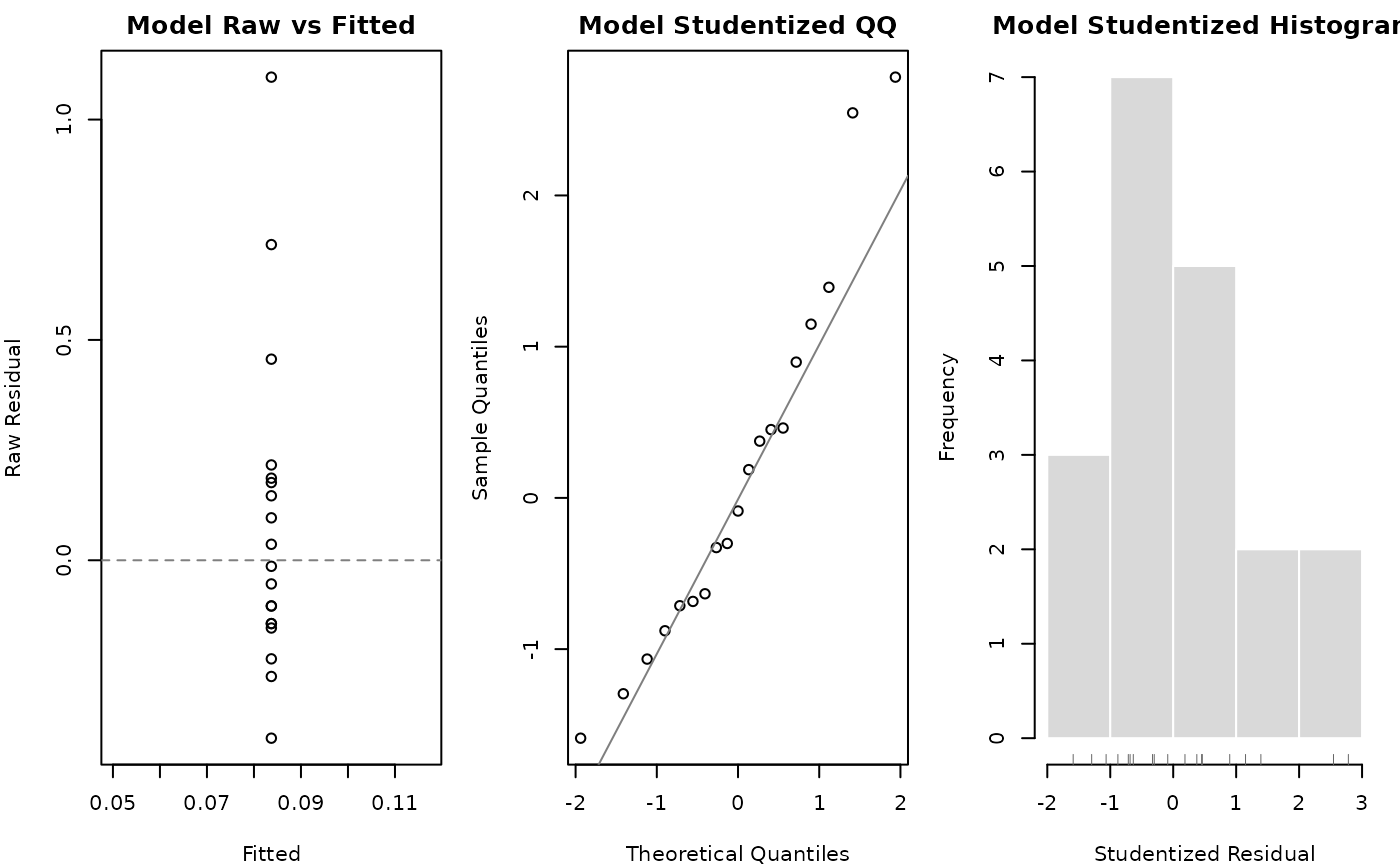
plot_residual_panel.RdDraw a compact three-panel residual diagnostic figure showing raw residuals versus fitted values, a studentized residual QQ plot, and a studentized residual histogram.
Usage
plot_residual_panel(
  fit,
  main_prefix = "Model",
  fitted_jitter = 0,
  hist_breaks = "auto",
  hist_rug = TRUE,
  ...
)
Arguments
- fit
A fitted
marsobject.- main_prefix
Prefix used for the panel titles.
- fitted_jitter
Non-negative numeric scalar giving the horizontal jitter amount applied to fitted values in the raw-residual-versus-fitted panel. Use
0to disable jitter.- hist_breaks
Histogram breaks for the studentized residual panel. Use
"auto"to select"Sturges"when fewer than 30 finite studentized residuals are available and"FD"otherwise. Passed tohist()after resolution.- hist_rug
Logical; if
TRUE, draw a rug plot beneath the histogram using the finite studentized residuals.- ...
Additional arguments passed to the first
plot()call.
Value
Invisibly returns a data frame containing the fitted values, jittered fitted values used for plotting, raw residuals, studentized residuals, and the histogram break rule used.
Examples
# \donttest{
fit <- mars(
  data = teacher_expectancy,
  studyID = "study",
  effectID = NULL,
  sample_size = NULL,
  formula = yi ~ 1,
  variance = "vi",
  varcov_type = "univariate",
  structure = "univariate"
)
plot_residual_panel(fit)

# }
# }