PRISMA Flow Diagram (Base R)
prisma_diagram.RdDraws a PRISMA-style flow diagram using base graphics, with support for both new reviews and updated reviews.
Usage
prisma_diagram(
  counts,
  review_type = c("new", "updated"),
  labels = NULL,
  show_exclusion_boxes = TRUE,
  main = "PRISMA Flow Diagram",
  box_fill = "white",
  box_border = "black",
  arrow_col = "black",
  text_col = "black",
  cex = 0.78,
  cex_main = 1.05,
  main_adj = 0.5,
  main_line = NULL,
  line_lwd = 1.3,
  box_width = 0.36,
  side_box_width = 0.23,
  box_height = 0.085,
  box_gap = 0.045,
  side_gap = 0.05,
  wrap_labels = TRUE,
  font_family = "sans",
  font_face = 1,
  title_font_face = 2,
  arrow_length = 0.055,
  arrow_angle = 22
)
Arguments
- counts
Named counts used in the flow diagram. Accepted formats are:
named numeric vector
named list
one-row data frame with named columns
- review_type
Type of review flow to draw:
"new"or"updated".- labels
Optional named character vector/list to override default box labels. Names must correspond to known flow elements.
- show_exclusion_boxes
Logical. If
TRUE, displays side exclusion boxes (for example, records excluded at screening).- main
Main plot title.
- box_fill
Fill color for boxes.
- box_border
Border color for boxes.
- arrow_col
Arrow color.
- text_col
Text color used inside boxes.
- cex
Text size for box labels.
- cex_main
Title size.
- main_adj
Horizontal title alignment in
[0, 1].- main_line
Optional title line. If
NULL, default is used.- line_lwd
Line width for box borders and arrows.
- box_width
Width of central flow boxes.
- side_box_width
Width of side boxes.
- box_height
Box height.
- box_gap
Vertical gap between central flow boxes.
- side_gap
Horizontal gap between central and side boxes.
- wrap_labels
Logical. If
TRUE, wraps labels to fit box widths.- font_family
Font family used for the diagram text.
- font_face
Font face used for box text (
1= plain,2= bold).- title_font_face
Font face for the main title.
- arrow_length
Arrowhead length.
- arrow_angle
Arrowhead angle in degrees.
Value
Invisibly returns a list containing:
- counts
Named numeric counts used for plotting (including computed totals for updated reviews).
- labels
Named character vector of labels used in the boxes.
- review_type
Review type used (
"new"or"updated").
Details
The function is intentionally flexible: counts can be a named numeric
vector, named list, or one-row data frame.
Examples
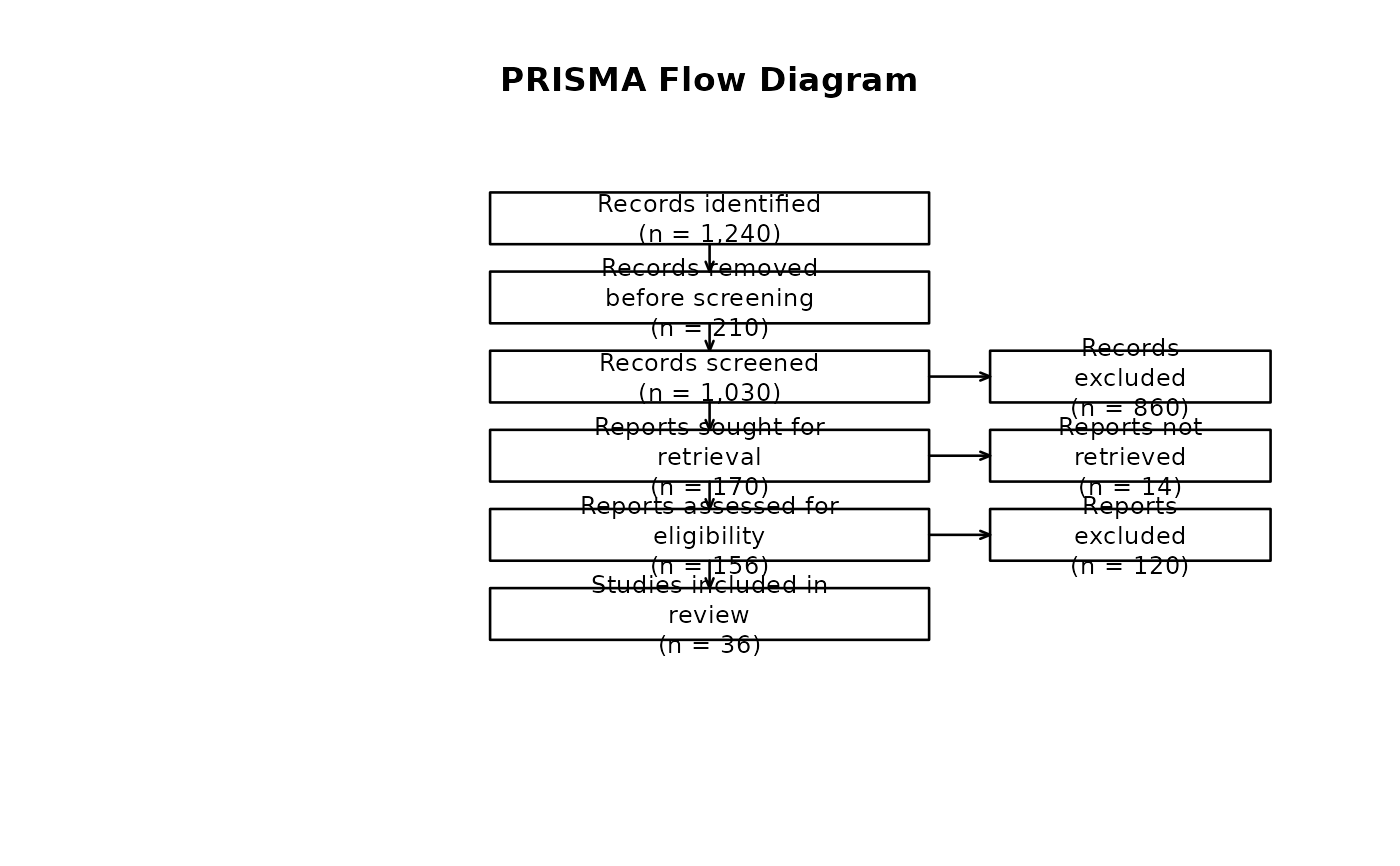
new_counts <- c(
records_identified = 1240,
records_removed = 210,
records_screened = 1030,
records_excluded = 860,
reports_sought = 170,
reports_not_retrieved = 14,
reports_assessed = 156,
reports_excluded = 120,
studies_included = 36
)
prisma_diagram(new_counts)
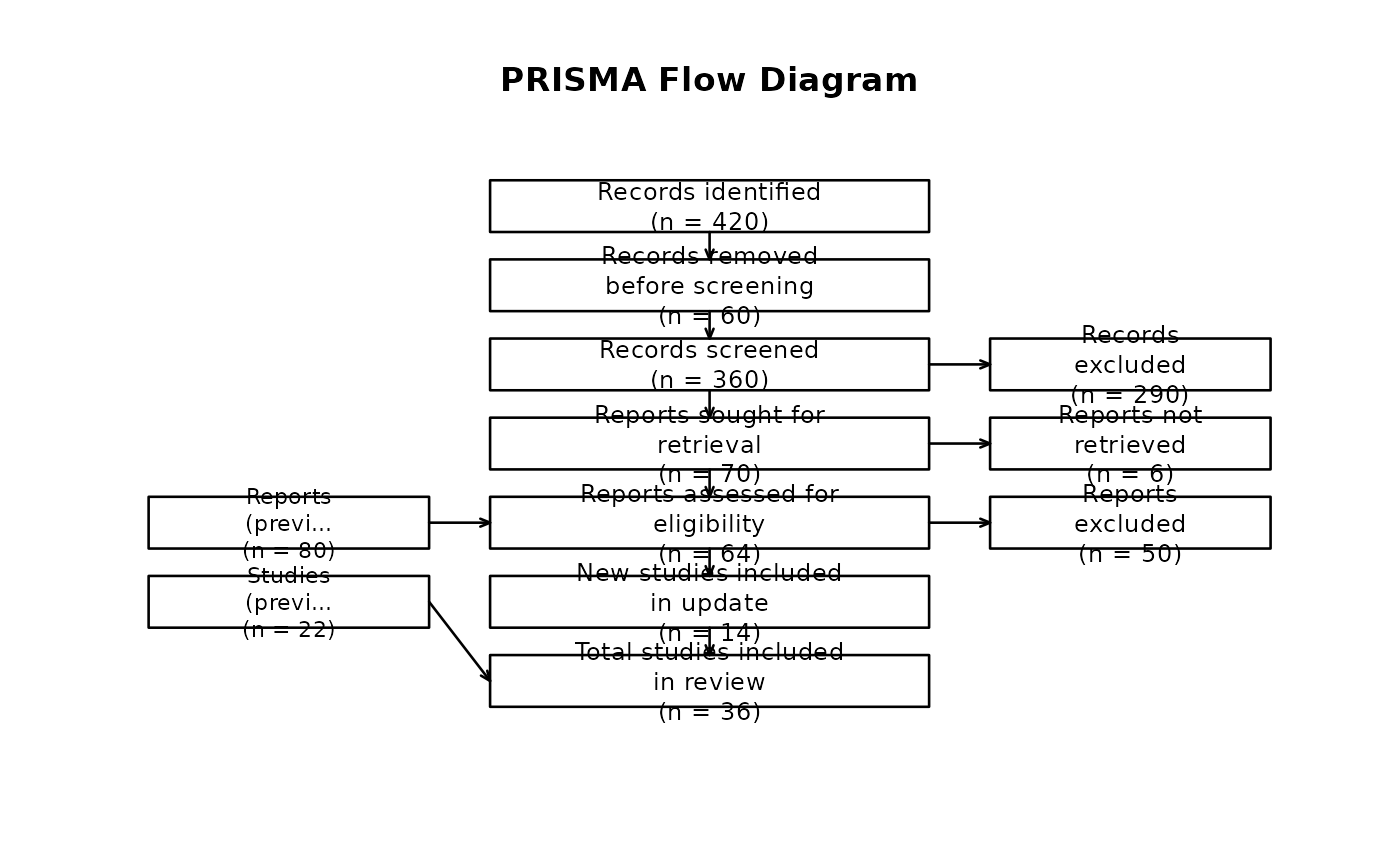
 updated_counts <- c(
records_identified = 420,
records_removed = 60,
records_screened = 360,
records_excluded = 290,
reports_sought = 70,
reports_not_retrieved = 6,
reports_assessed = 64,
reports_excluded = 50,
studies_included = 14,
previous_reports = 80,
previous_studies = 22
)
prisma_diagram(updated_counts, review_type = "updated")
updated_counts <- c(
records_identified = 420,
records_removed = 60,
records_screened = 360,
records_excluded = 290,
reports_sought = 70,
reports_not_retrieved = 6,
reports_assessed = 64,
reports_excluded = 50,
studies_included = 14,
previous_reports = 80,
previous_studies = 22
)
prisma_diagram(updated_counts, review_type = "updated")