Risk-of-Bias Traffic Light and Aggregate Bar Plot
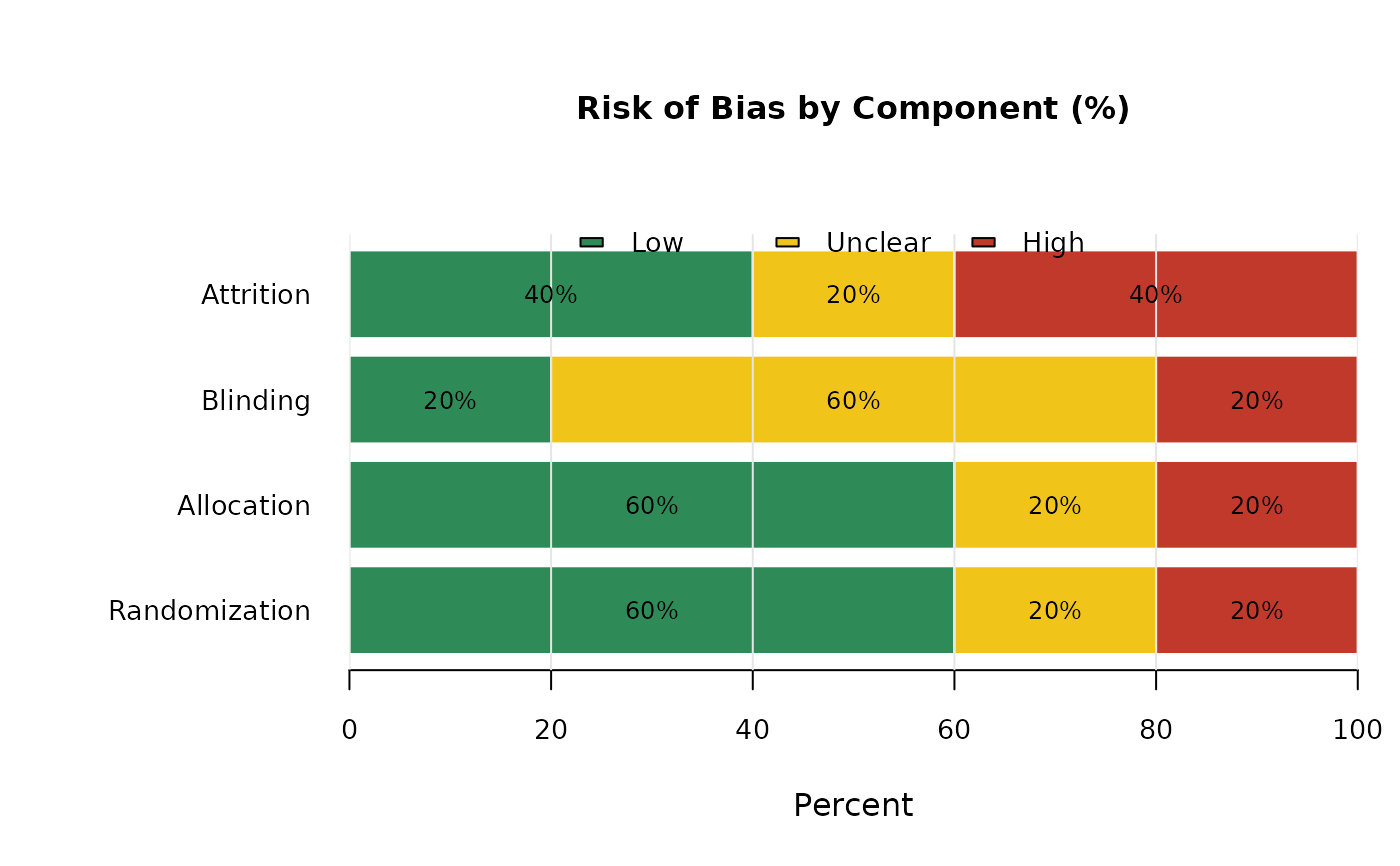
risk_of_bias_plot.RdDraws a study-level traffic-light plot of risk-of-bias judgments and a component-level stacked bar plot of percentages (Low, Unclear, High).
Usage
risk_of_bias_plot(
  data,
  study,
  component,
  decision,
  study_order = NULL,
  component_order = NULL,
  main_traffic = "Risk of Bias (Study Level)",
  main_aggregate = "Risk of Bias by Component (%)",
  low_col = "#2E8B57",
  unclear_col = "#F0C419",
  high_col = "#C0392B",
  cex_axis = 0.85,
  cex_main = 1,
  study_legend_position = "top",
  aggregate_legend_position = "top",
  study_legend_title = NULL,
  aggregate_legend_title = NULL,
  legend_inset = c(0, -0.13),
  main_traffic_adj = 0.5,
  main_aggregate_adj = 0.5,
  plot = c("both", "study", "aggregate"),
  separate_plots = FALSE,
  aggregate_horizontal = FALSE
)
Arguments
- data
A data frame in long format.
- study
Character string naming the study ID column.
- component
Character string naming the risk-of-bias component/domain column.
- decision
Character string naming the judgment column. Values are matched to
"Low","Unclear", and"High"(case-insensitive). Common misspellings such as"uncler"are accepted.- study_order
Optional character vector with custom study order.
- component_order
Optional character vector with custom component order.
- main_traffic
Title for the traffic-light panel.
- main_aggregate
Title for the aggregate stacked-bar panel.
- low_col
Color used for low risk.
- unclear_col
Color used for unclear risk.
- high_col
Color used for high risk.
- cex_axis
Axis text scaling.
- cex_main
Main title scaling.
- study_legend_position
Legend position for the study panel. Use
"none"to suppress.- aggregate_legend_position
Legend position for the aggregate panel. Use
"none"to suppress.- study_legend_title
Optional legend title for the study panel.
- aggregate_legend_title
Optional legend title for the aggregate panel.
- legend_inset
Numeric legend inset passed to
graphics::legend().- main_traffic_adj
Horizontal title alignment in
[0, 1]for the study panel title.- main_aggregate_adj
Horizontal title alignment in
[0, 1]for the aggregate panel title.- plot
Which panel(s) to draw:
"both","study", or"aggregate".- separate_plots
Logical. If
TRUEandplot = "both", the study-level and aggregate plots are drawn on separate plot pages.- aggregate_horizontal
Logical. If
TRUE, the aggregate percentages are drawn as horizontal stacked bars.
Value
Invisibly returns a list containing:
- decision_matrix
Study x component matrix with values
"Low","Unclear", or"High".- counts
Component x decision count matrix.
- percentages
Component x decision percentage matrix (rows sum to 100).
Examples
rob_dat <- data.frame(
  study = rep(paste0("Study_", 1:5), each = 4),
  component = rep(c("Randomization", "Allocation", "Blinding", "Attrition"), 5),
  decision = c(
    "Low", "Low", "Unclear", "High",
    "Low", "Unclear", "Unclear", "High",
    "High", "High", "Unclear", "Low",
    "Low", "Low", "Low", "Low",
    "Uncler", "Low", "High", "Unclear"
  ),
  stringsAsFactors = FALSE
)

risk_of_bias_plot(
  data = rob_dat,
  study = "study",
  component = "component",
  decision = "decision",
  plot = "aggregate",
  aggregate_horizontal = TRUE
)