PRISMA Flow Diagrams
mars authors
2026-05-15
PRISMA-Diagrams.RmdThis vignette demonstrates prisma_diagram(), a base-R
PRISMA flow diagram function that supports both:
- New systematic reviews (
review_type = "new") - Updated reviews (
review_type = "updated")
library(mars)New Review Flow
new_counts <- c(
  records_identified = 1240,
  records_removed = 210,
  records_screened = 1030,
  records_excluded = 860,
  reports_sought = 170,
  reports_not_retrieved = 14,
  reports_assessed = 156,
  reports_excluded = 120,
  studies_included = 36
)
out_new <- prisma_diagram(new_counts)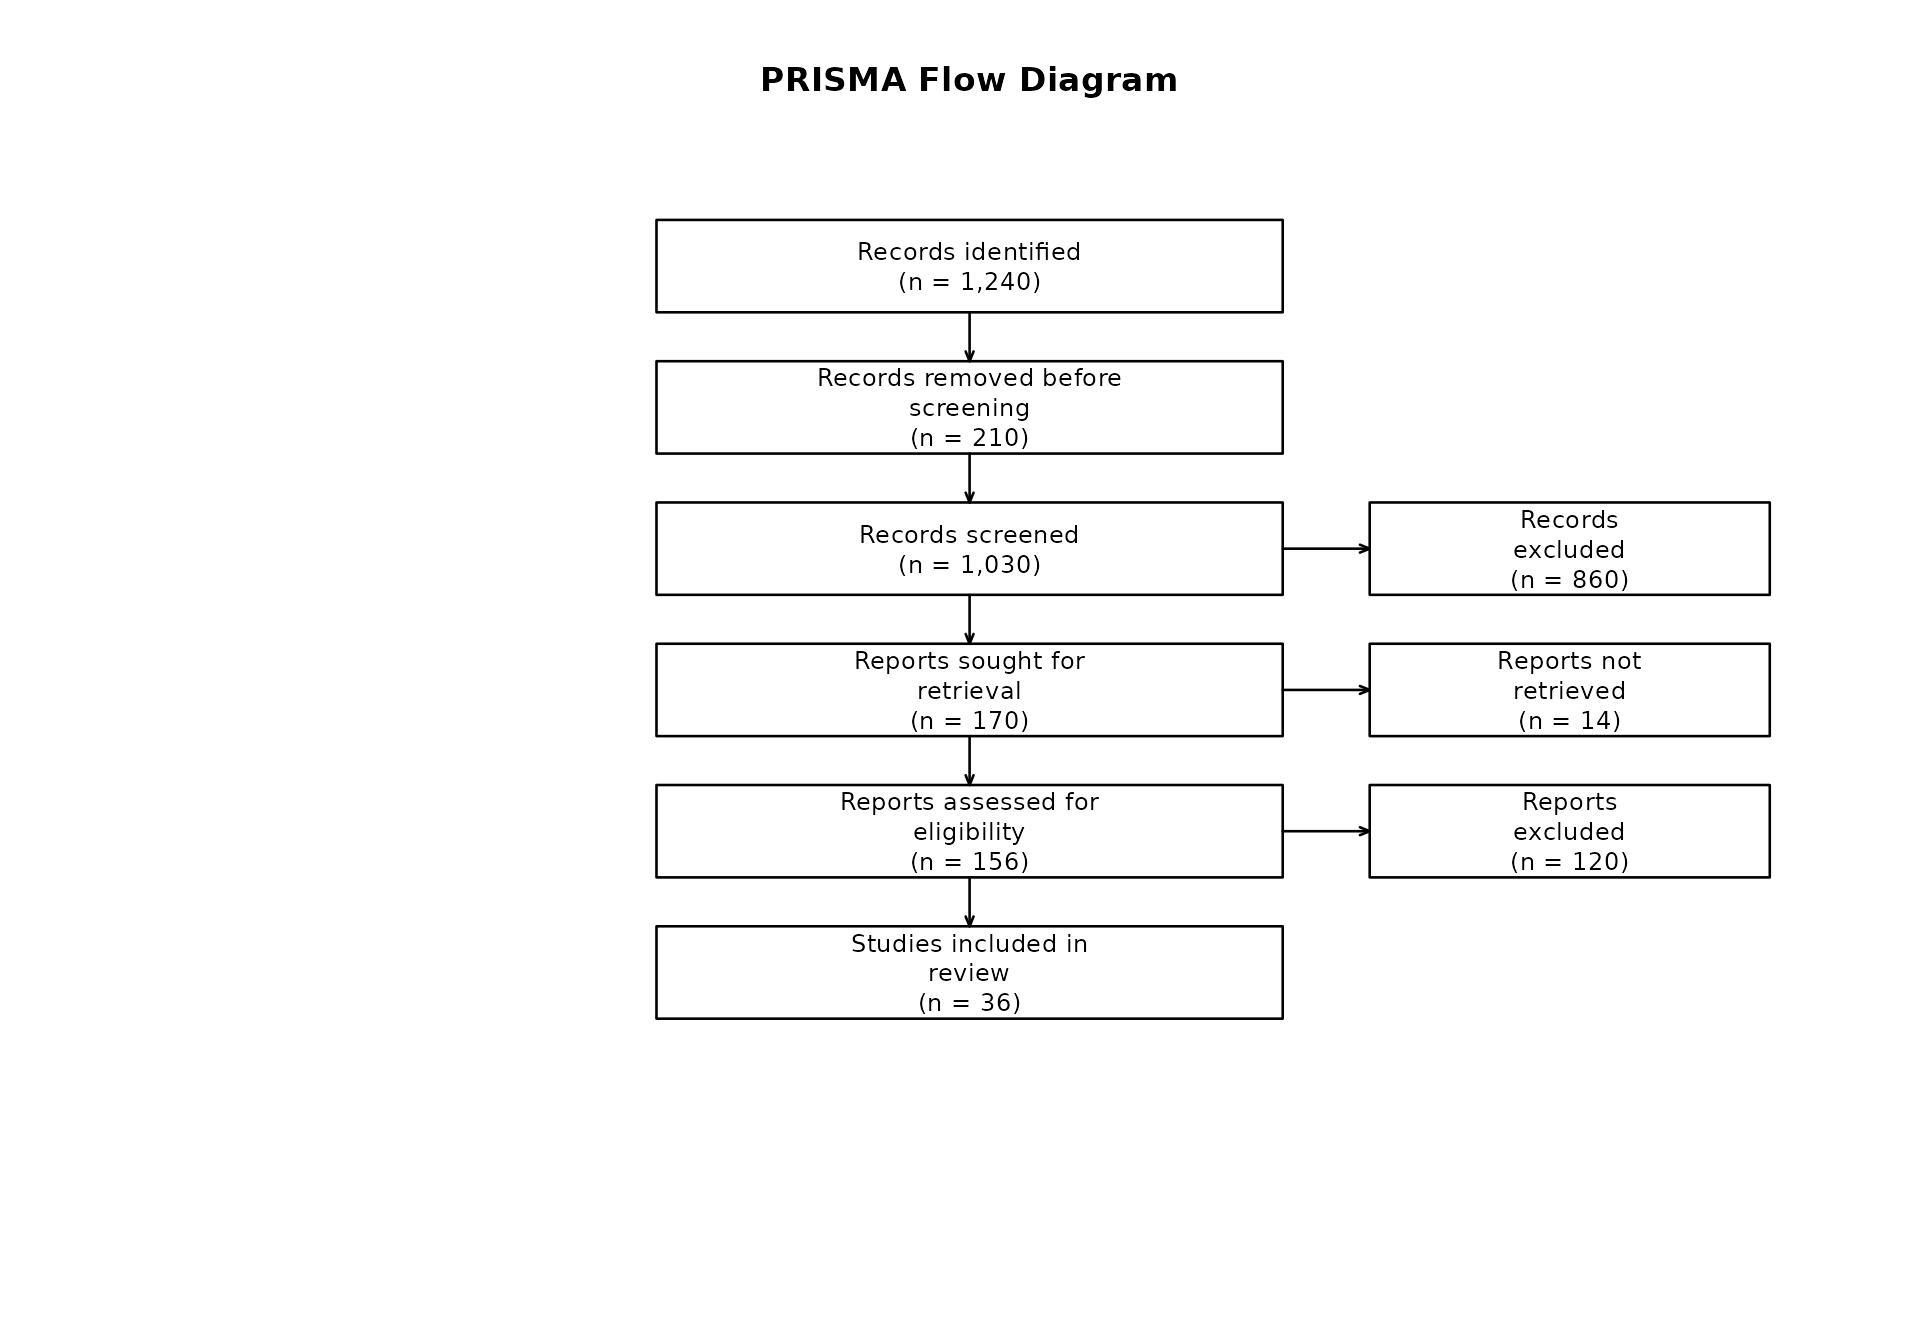
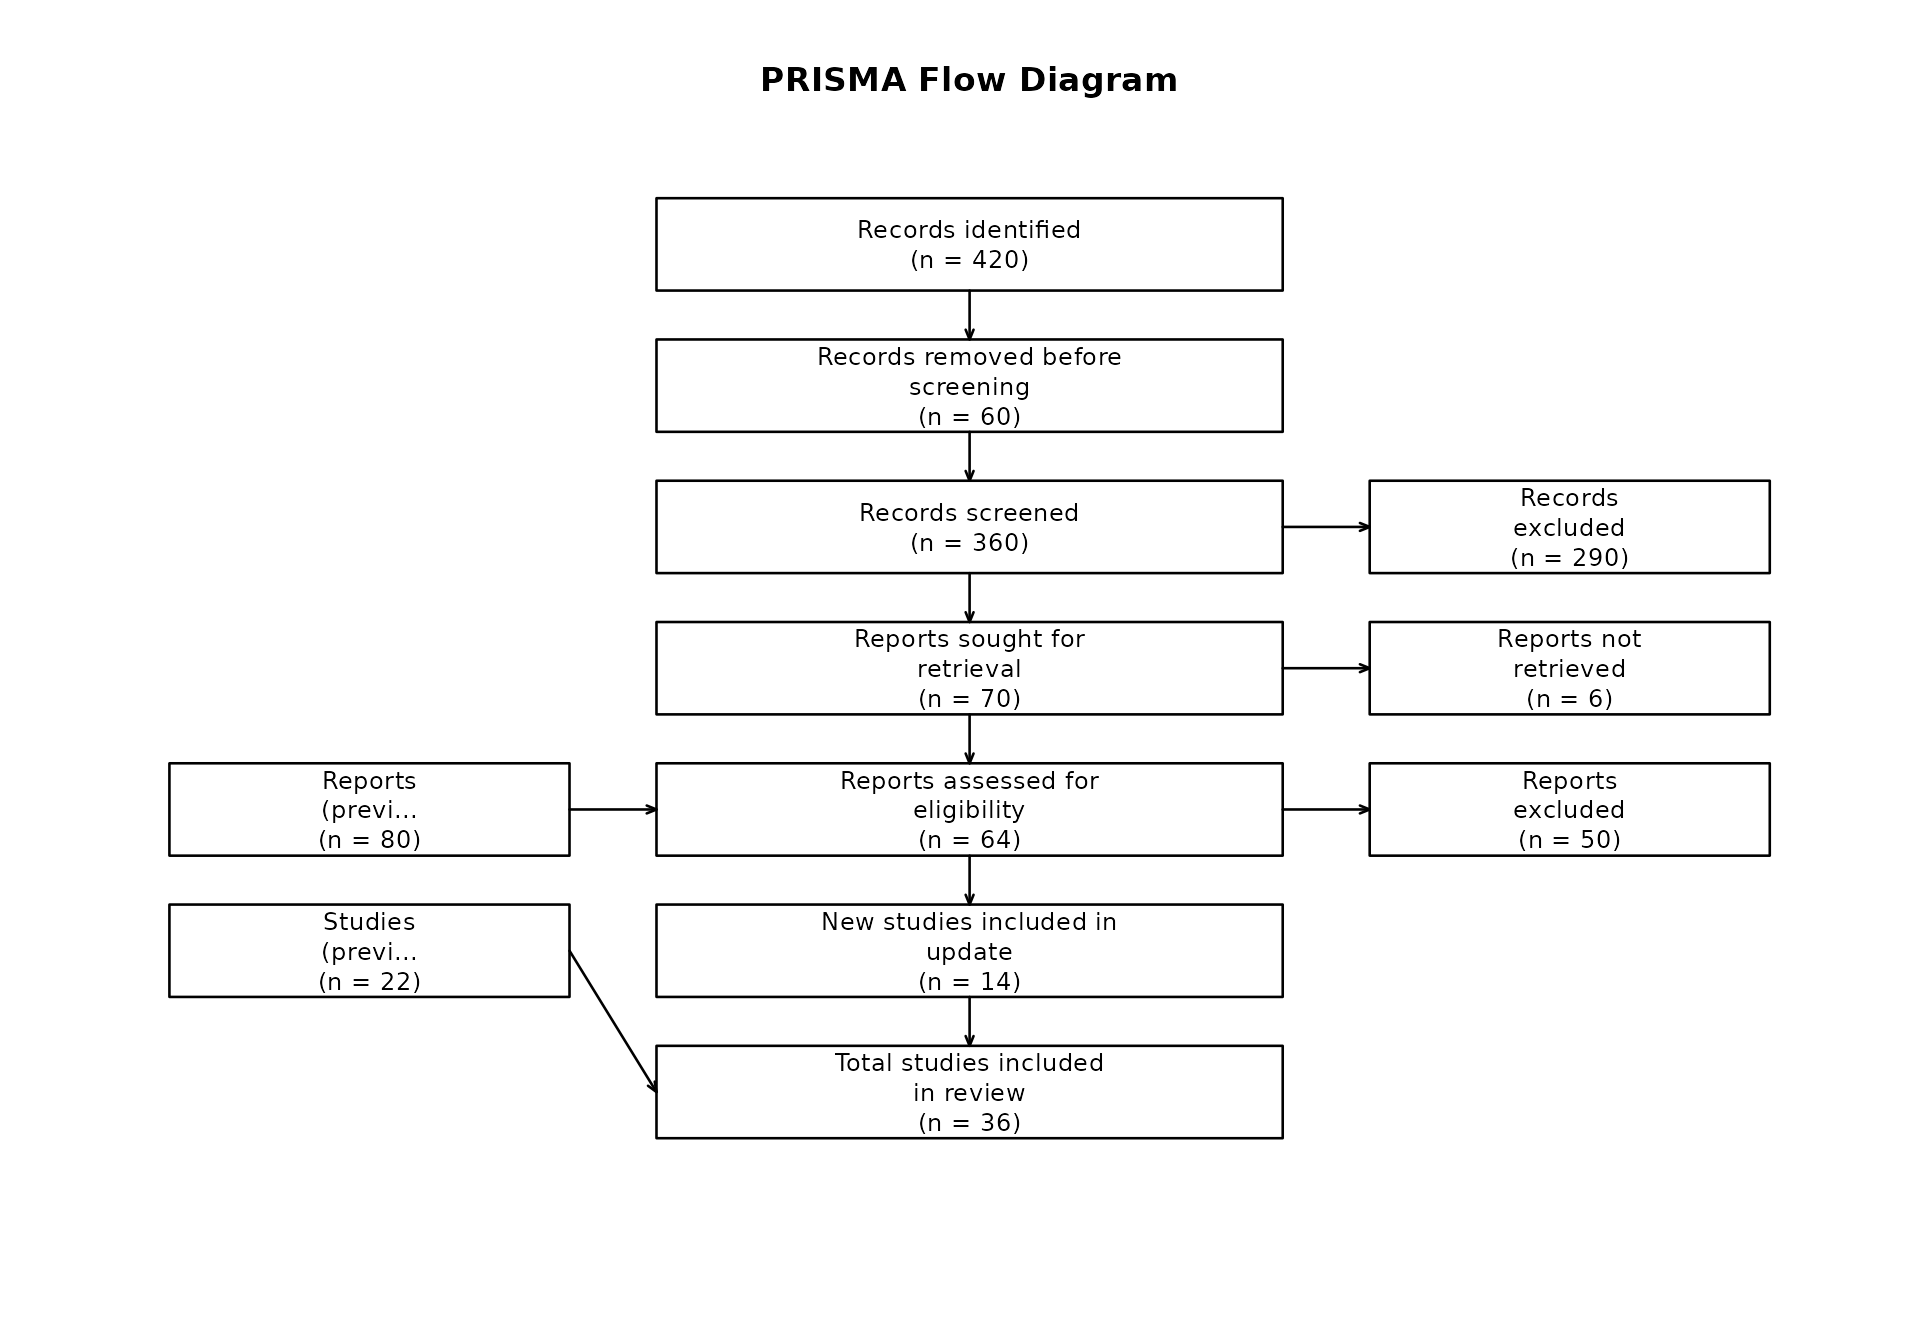
Updated Review Flow
For updated reviews, include prior-version information:
previous_reportsprevious_studies
total_studies is optional and is computed automatically
when omitted.
updated_counts <- c(
  records_identified = 420,
  records_removed = 60,
  records_screened = 360,
  records_excluded = 290,
  reports_sought = 70,
  reports_not_retrieved = 6,
  reports_assessed = 64,
  reports_excluded = 50,
  studies_included = 14,
  previous_reports = 80,
  previous_studies = 22
)
out_updated <- prisma_diagram(
  counts = updated_counts,
  review_type = "updated"
)
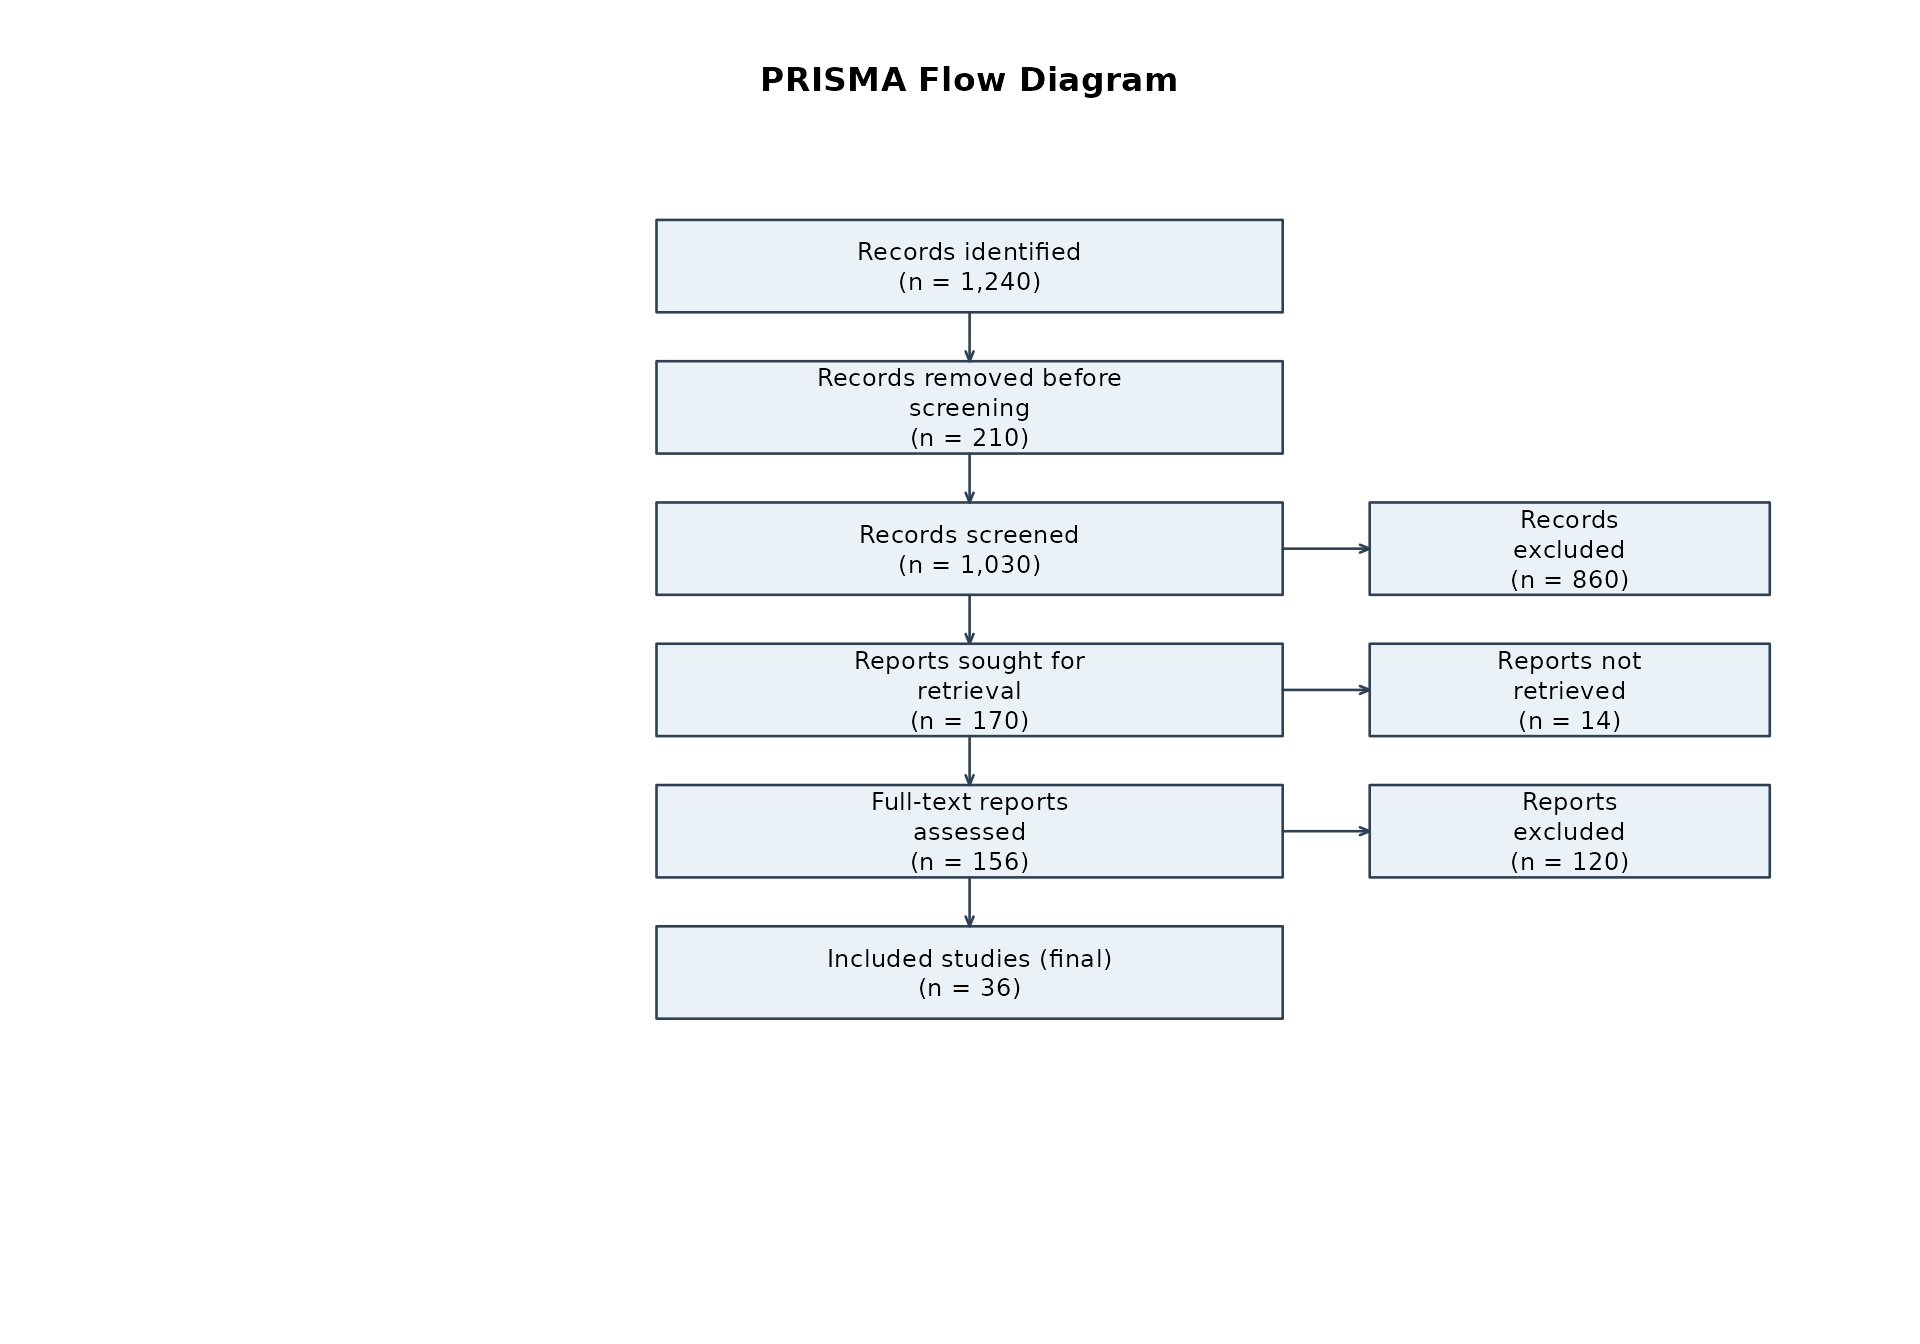
Flexible Input and Labels
The counts input can be a named vector, named list, or
one-row data frame. You can also override box labels.
prisma_diagram(
  counts = as.data.frame(as.list(new_counts)),
  labels = c(
    studies_included = "Included studies (final)",
    reports_assessed = "Full-text reports assessed"
  ),
  box_fill = "#EAF1F7",
  box_border = "#2E4053",
  arrow_col = "#2E4053"
)
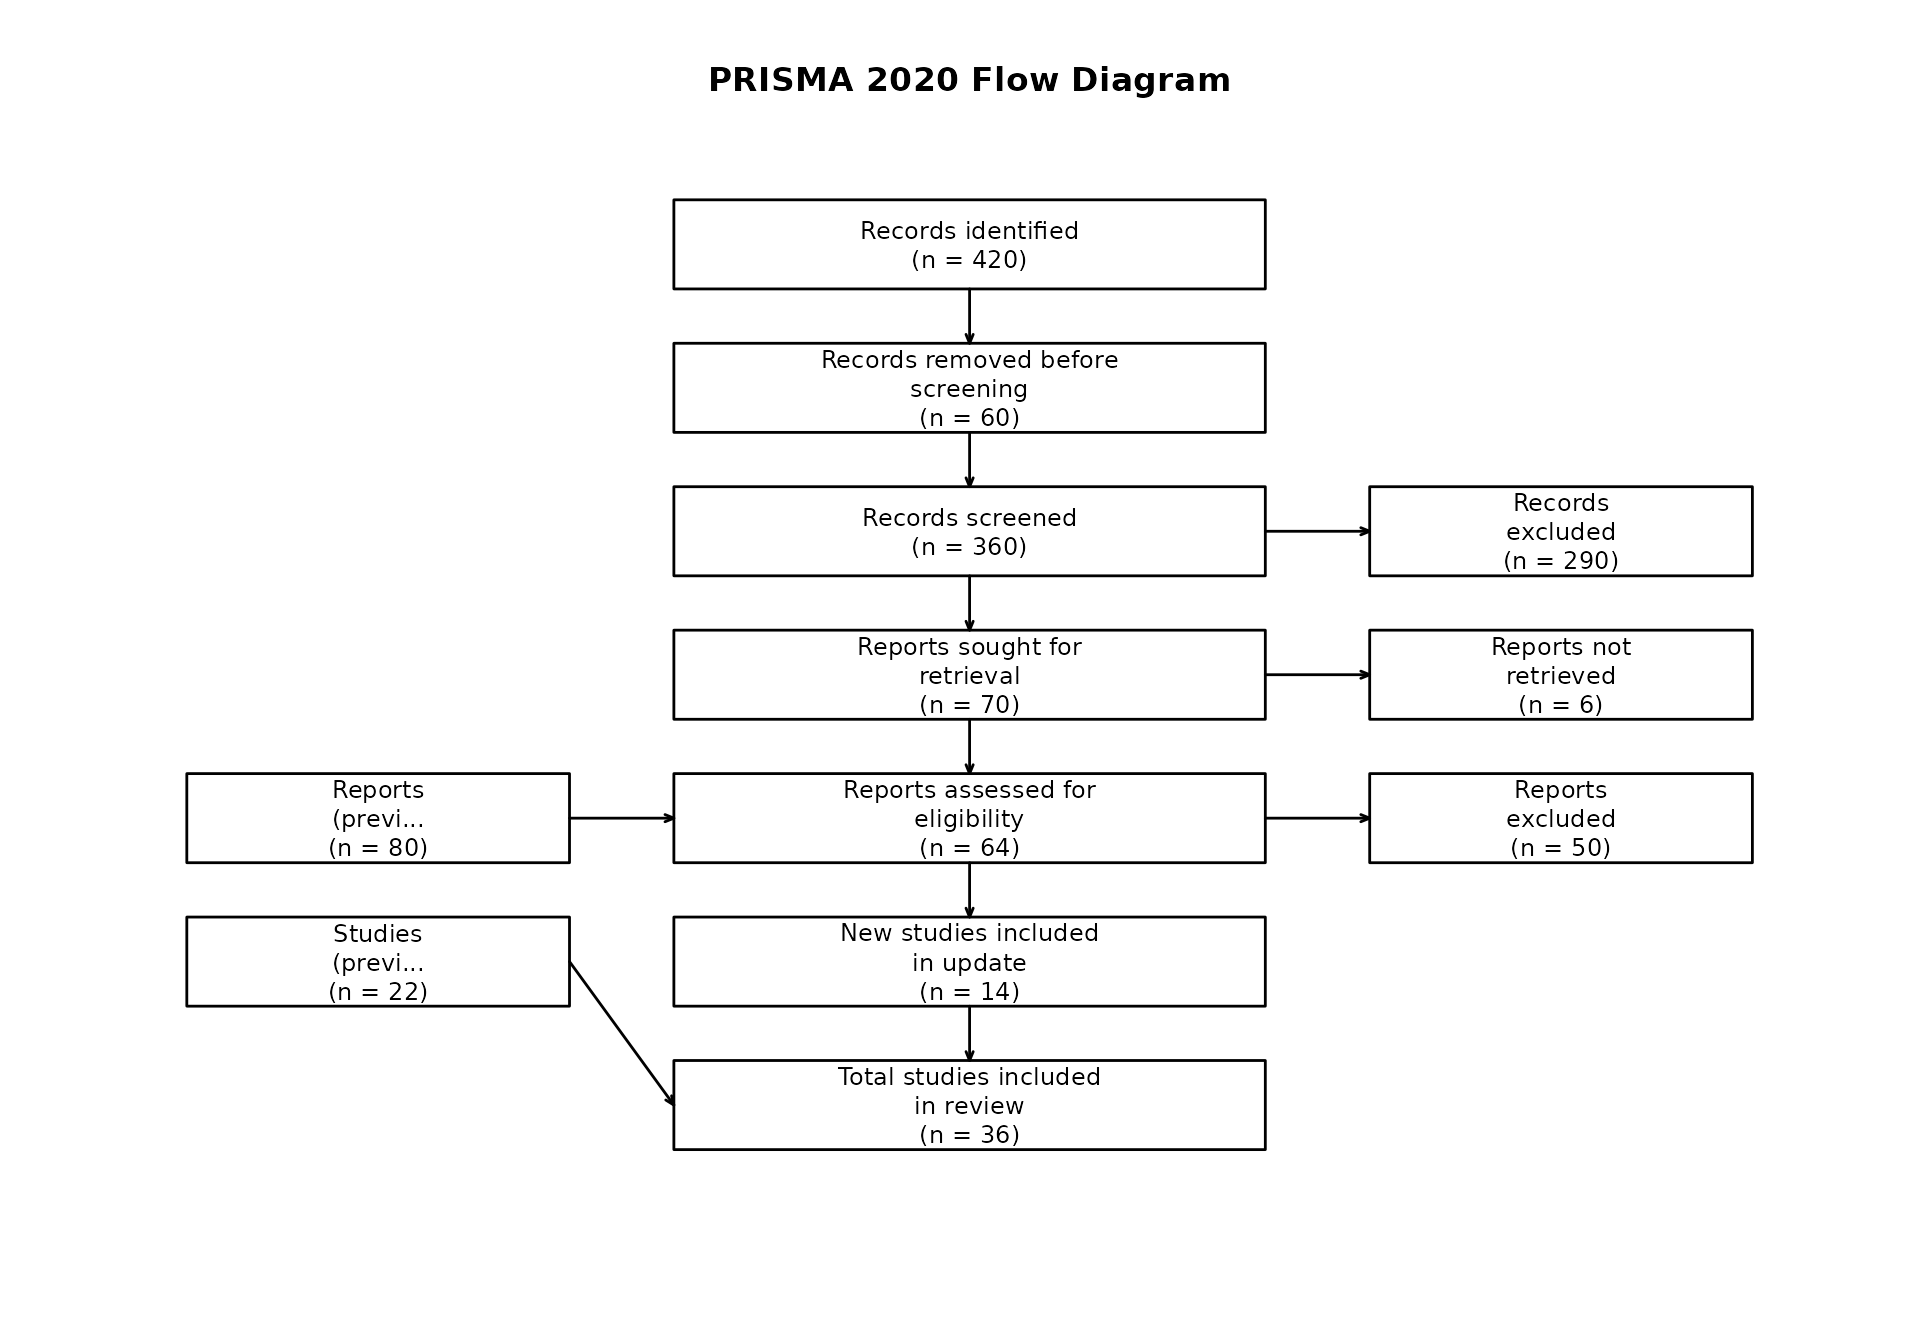
Publication-Ready Styling
Use spacing controls and monochrome styling for manuscript-ready figures.
prisma_diagram(
  counts = updated_counts,
  review_type = "updated",
  main = "PRISMA 2020 Flow Diagram",
  box_fill = "white",
  box_border = "black",
  arrow_col = "black",
  line_lwd = 1.4,
  box_width = 0.34,
  side_box_width = 0.22,
  box_height = 0.082,
  box_gap = 0.05,
  side_gap = 0.06,
  cex = 0.76,
  font_family = "sans",
  font_face = 1,
  title_font_face = 2,
  arrow_length = 0.05,
  arrow_angle = 22
)
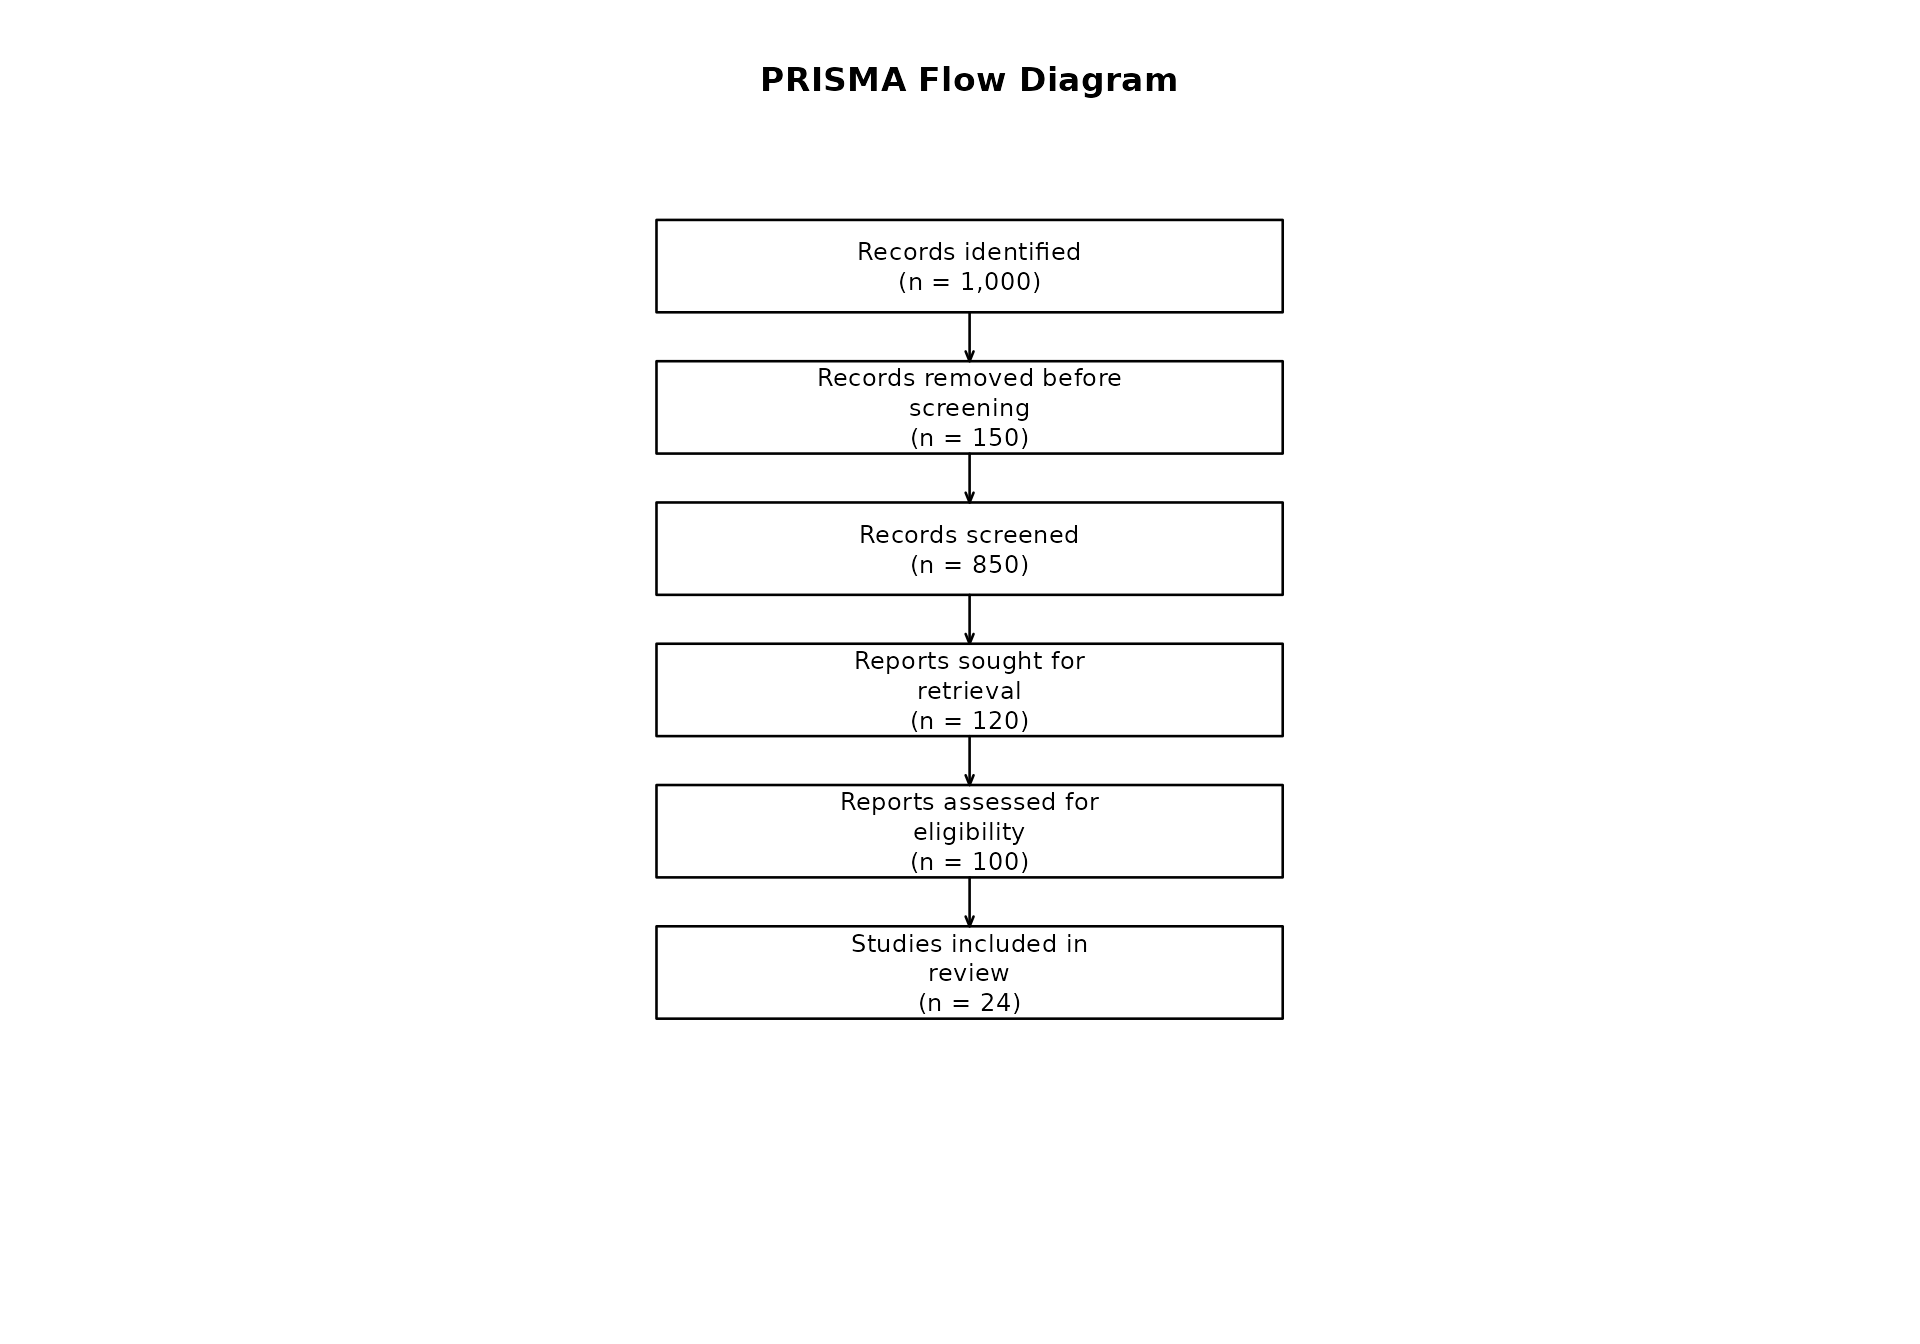
Minimal Layout (No Side Exclusion Boxes)
When counts for exclusions are unavailable, use
show_exclusion_boxes = FALSE.
prisma_diagram(
  counts = c(
    records_identified = 1000,
    records_removed = 150,
    records_screened = 850,
    reports_sought = 120,
    reports_assessed = 100,
    studies_included = 24
  ),
  show_exclusion_boxes = FALSE
)
Returned Objects
The function returns a list invisibly:
names(out_updated)
#> [1] "counts"      "labels"      "review_type"
out_updated$counts
#>    records_identified       records_removed      records_screened
#>                   420                    60                   360
#>      records_excluded        reports_sought reports_not_retrieved
#>                   290                    70                     6
#>      reports_assessed      reports_excluded      studies_included
#>                    64                    50                    14
#>      previous_reports      previous_studies         total_studies
#>                    80                    22                    36