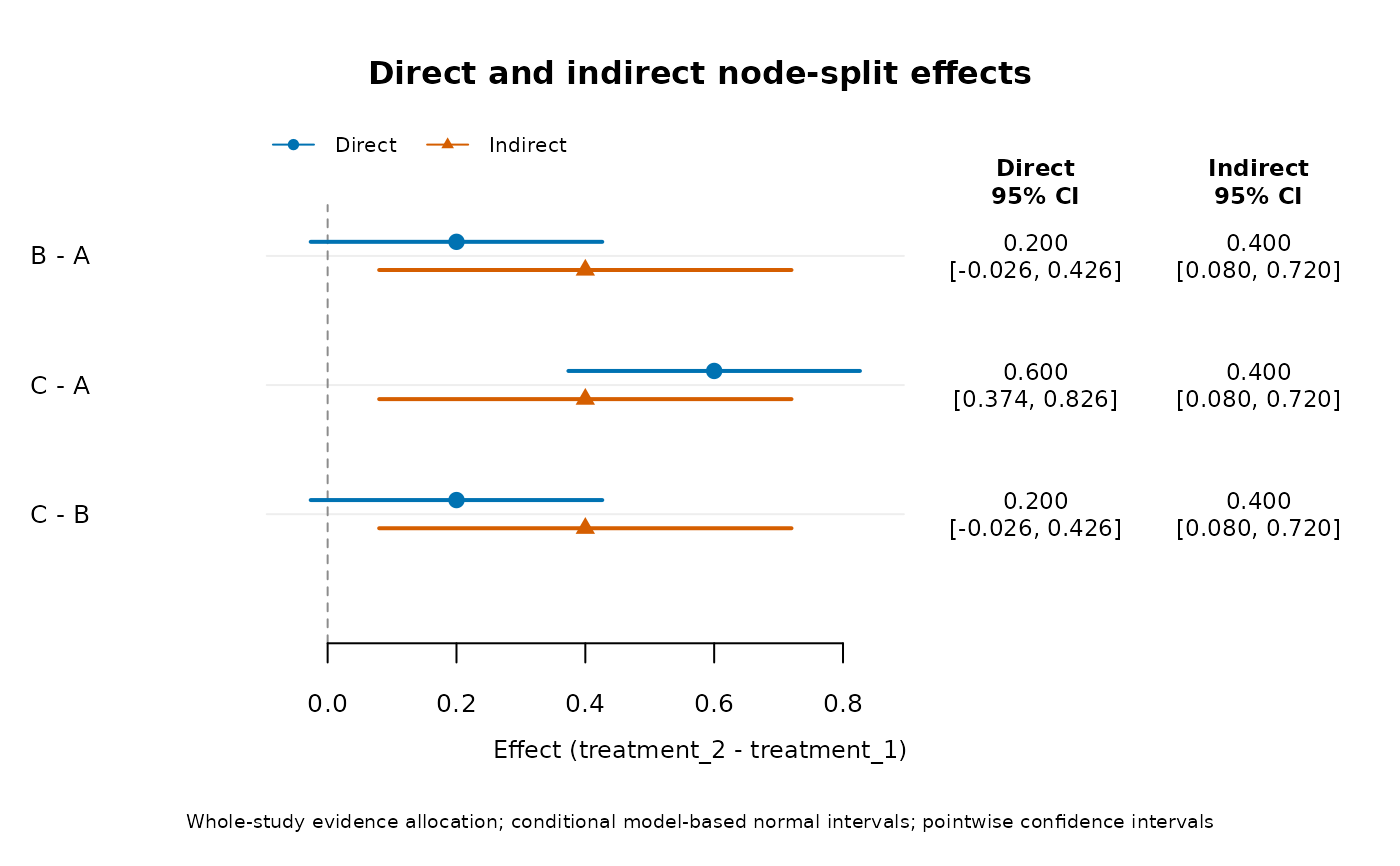
Plot direct and indirect node-split effects side by side
network_nodesplit_plot.RdDisplay independently allocated direct and indirect evidence estimates with separate pointwise confidence intervals and numerical columns.
Arguments
- object
A fitted joint network model.
- method
conditionalholds fitted heterogeneity fixed;MLrefits heterogeneity jointly in each split model. Both use normal Wald inference.- comparisons
Optional data frame with
treatment_1andtreatment_2columns selecting unordered pairs. Selection includes all fitted mean strata; reversing a requested pair does not reverse the returned contrast direction.- level
Coverage of pointwise normal-approximation intervals for direct effects, indirect effects and their difference.
- adjust
none,holm, orbonferronifor the requested node-split pair/stratum family, retaining nonestimable hypotheses in its size. Output addsp_adjustedand anadjustmentattribute. Intervals are pointwise.- strata
Named list selecting fitted outcome/time strata for display. Adjustment uses all requested comparisons before this display selection.
- main
Plot title.
- estimable_only
Logical; omit unavailable splits from the figure (default
FALSE). Returned rows and the adjustment family are unchanged.- point_cex
Scaling for point markers.
- label_cex
Scaling for treatment/axis labels. Font family and style inherit base graphics settings such as
par(family="sans", font=1).
Value
Invisibly returns the selected node-split table, including confidence limits, adjusted p-values, estimability and failure reasons.
Details
Calls network_nodesplit() and plots treatment_2 minus treatment_1 for each
pair/stratum. The direct and indirect series use separate symbols and vertical
offsets on a shared effect axis. Unavailable evidence is labelled not estimable;
an available direct estimate is still shown when an indirect route is absent.
Intervals are model-based normal intervals, conditional on the fitted covariance
or the jointly refitted ML covariance. adjust changes the difference-test
p-values in the returned table, not these pointwise intervals. Interval overlap
is not the direct-minus-indirect Wald test: use the returned difference interval
and p-value, which retain direct-indirect covariance.
These whole-study node splits differ from the descriptive conditional GLS
summaries displayed by network_forest_overlay_plot(). For a plot of the
direct-minus-indirect difference, use network_incoherence_plot() with
display="nodesplit".
Examples
d <- data.frame(s=1:9,a=rep(c("A","A","B"),3),
  b=rep(c("B","C","C"),3),g=rep(c(.2,.6,.2),3),v=.04)
fit <- network_meta(d,"s","a","b","g","v")
network_nodesplit_plot(fit,adjust="holm")