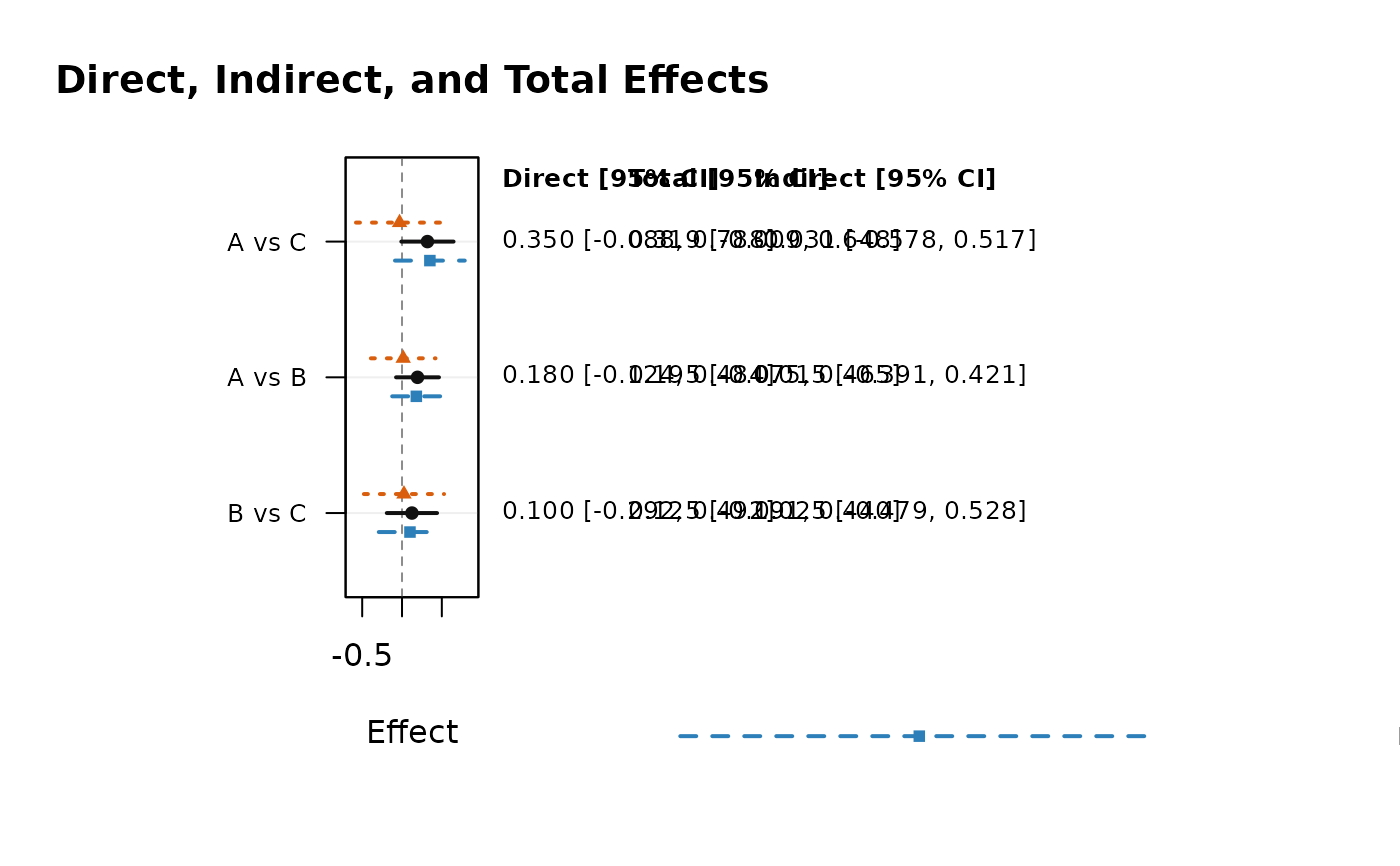
Overlay Forest Plot for Direct, Indirect, and Total Network Effects
network_forest_overlay_plot.RdDraws a comparison-level forest plot with nearly overlapping lines for direct,
indirect, and total effects from a fitted network_meta object.
Usage
network_forest_overlay_plot(
  nma_object,
  ci_level = 0.95,
  order_by = c("total", "abs_total", "comparison"),
  decreasing = FALSE,
  xlab = "Effect",
  main = "Direct, Indirect, and Total Effects",
  ref_line = 0,
  line_offsets = c(direct = -0.14, total = 0, indirect = 0.14),
  colors = c(direct = "#2C7FB8", total = "#111111", indirect = "#D95F0E"),
  pch = c(direct = 15, total = 19, indirect = 17),
  line_types = c(direct = 2, total = 1, indirect = 3),
  line_lwd = 2,
  point_cex = 0.8,
  label_cex = 0.8,
  right_label = c("all", "total", "none"),
  right_digits = 3,
  ref_col = "gray55",
  legend_position = "bottom",
  legend_title = NULL,
  main_adj = 0.5,
  main_line = NULL
)
Arguments
- nma_object
A fitted object returned by
network_meta.- ci_level
Confidence level for interval bounds. Defaults to
0.95.- order_by
Ordering rule for rows. One of
"total","abs_total", or"comparison".- decreasing
Logical; whether to reverse the selected order.
- xlab
Label for x-axis.
- main
Plot title.
- ref_line
Vertical reference line location. Defaults to
0.- line_offsets
Named numeric vector for vertical offsets of
direct,total, andindirectrows.- colors
Named color vector for
direct,total, andindirect.- pch
Named point-symbol vector for
direct,total, andindirect.- line_types
Named line-type vector for
direct,total, andindirect.- line_lwd
Confidence interval line width.
- point_cex
Point size scaling.
- label_cex
Label size scaling.
- right_label
One of
"all","total", or"none"for right-side annotation columns.- right_digits
Number of digits shown in right-side labels.
- ref_col
Color of the vertical reference line.
- legend_position
Legend position. Use
"bottom"for default outside placement, a standard base-R legend keyword, numeric coordinates, or"none".- legend_title
Optional legend title.
- main_adj
Horizontal title alignment in
[0, 1].- main_line
Optional title line. If
NULL, default is used.