Evidence Gap Map Plot
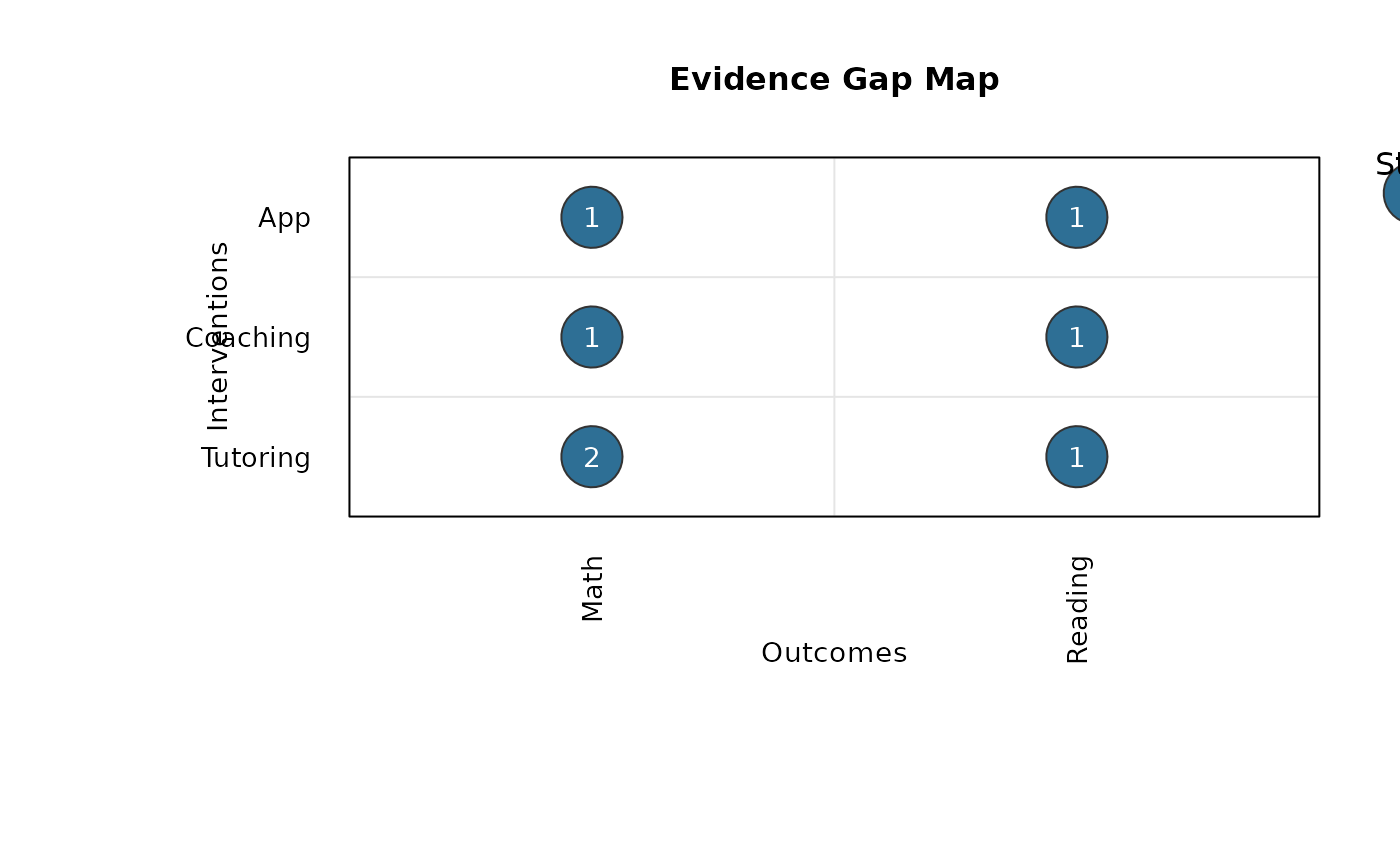
gap_map_plot.RdCreates a base-R evidence gap map with outcomes and interventions on the axes, bubble sizes representing number of studies, and labels inside bubbles representing number of effect sizes.
Usage
gap_map_plot(
  data,
  intervention,
  outcome,
  study_id = NULL,
  effect_id = NULL,
  n_studies = NULL,
  n_effects = NULL,
  switch_axes = FALSE,
  intervention_order = NULL,
  outcome_order = NULL,
  bubble_range = c(1.5, 7),
  bubble_col = "#2E6F95",
  bubble_border = "gray20",
  text_col = "white",
  display_effect_labels = TRUE,
  effect_label_cex = 0.9,
  bubble_size_by = c("studies", "effects"),
  label_value = c("effects", "studies"),
  draw_mode = c("both", "bubbles_only", "labels_only"),
  show_grid = TRUE,
  grid_col = "gray90",
  show_size_legend = TRUE,
  size_legend_title = NULL,
  size_legend_values = NULL,
  main = "Evidence Gap Map",
  xlab = NULL,
  ylab = NULL,
  cex_axis = 0.85,
  cex_main = 1,
  size_legend_position = "outside_right",
  size_legend_inset = 0,
  main_adj = 0.5,
  main_line = NULL
)
Arguments
- data
A data frame.
- intervention
Character string naming the intervention column.
- outcome
Character string naming the outcome column.
- study_id
Optional character string naming the study ID column (for long-format input). If omitted,
n_studiesmust be supplied.- effect_id
Optional character string naming the effect size ID column (for long-format input). If omitted and
n_effectsis not supplied, each row is treated as one effect size.- n_studies
Optional character string naming a numeric column with pre-aggregated study counts per cell.
- n_effects
Optional character string naming a numeric column with pre-aggregated effect-size counts per cell.
- switch_axes
Logical. If
TRUE, outcomes are on the x-axis and interventions are on the y-axis.- intervention_order
Optional character vector for intervention ordering.
- outcome_order
Optional character vector for outcome ordering.
- bubble_range
Numeric vector of length 2 with minimum and maximum point sizes (
cex) for bubbles.- bubble_col
Fill color for bubbles.
- bubble_border
Border color for bubbles.
- text_col
Text color for the number of effect sizes inside bubbles.
- display_effect_labels
Logical. If
TRUE, prints effect-size counts inside bubbles.- effect_label_cex
Numeric scaling for effect-size labels.
- bubble_size_by
Which metric controls bubble size:
"studies"(default) or"effects".- label_value
Which metric is shown as text labels:
"effects"(default) or"studies".- draw_mode
What to draw:
"both"(bubbles + labels),"bubbles_only", or"labels_only"(numbers without bubbles).- show_grid
Logical. If
TRUE, draws grid lines between cells.- grid_col
Color for grid lines.
- show_size_legend
Logical. If
TRUE, draws a legend for bubble size.- size_legend_title
Title for the bubble-size legend. If
NULL, it is chosen automatically frombubble_size_by.- size_legend_values
Optional numeric vector of study-count values used in the size legend. If
NULL, values are selected automatically.- main
Main title.
- xlab
Optional x-axis label. If
NULL, generated automatically.- ylab
Optional y-axis label. If
NULL, generated automatically.- cex_axis
Axis label scaling.
- cex_main
Main title scaling.
- size_legend_position
Legend position keyword or numeric coordinates. Use
"none"to suppress the bubble-size legend. The default"outside_right"places it outside the plotting panel.- size_legend_inset
Numeric inset passed to
legend.- main_adj
Horizontal title alignment in
[0, 1].- main_line
Optional title line. If
NULL, default is used.
Value
Invisibly returns a list with:
- data
Aggregated data used for plotting (
intervention,outcome,n_studies,n_effects).- x_levels
Ordered x-axis levels.
- y_levels
Ordered y-axis levels.
Details
The function supports both long-format input (one row per effect size) and pre-aggregated input.
Examples
gap_dat <- data.frame(
study = c("S1", "S1", "S2", "S3", "S3", "S4", "S5"),
effect = c("E1", "E2", "E3", "E4", "E5", "E6", "E7"),
intervention = c("Tutoring", "Tutoring", "Tutoring", "Coaching", "Coaching", "App", "App"),
outcome = c("Math", "Math", "Reading", "Math", "Reading", "Reading", "Math"),
stringsAsFactors = FALSE
)
gap_map_plot(
data = gap_dat,
intervention = "intervention",
outcome = "outcome",
study_id = "study",
effect_id = "effect"
)
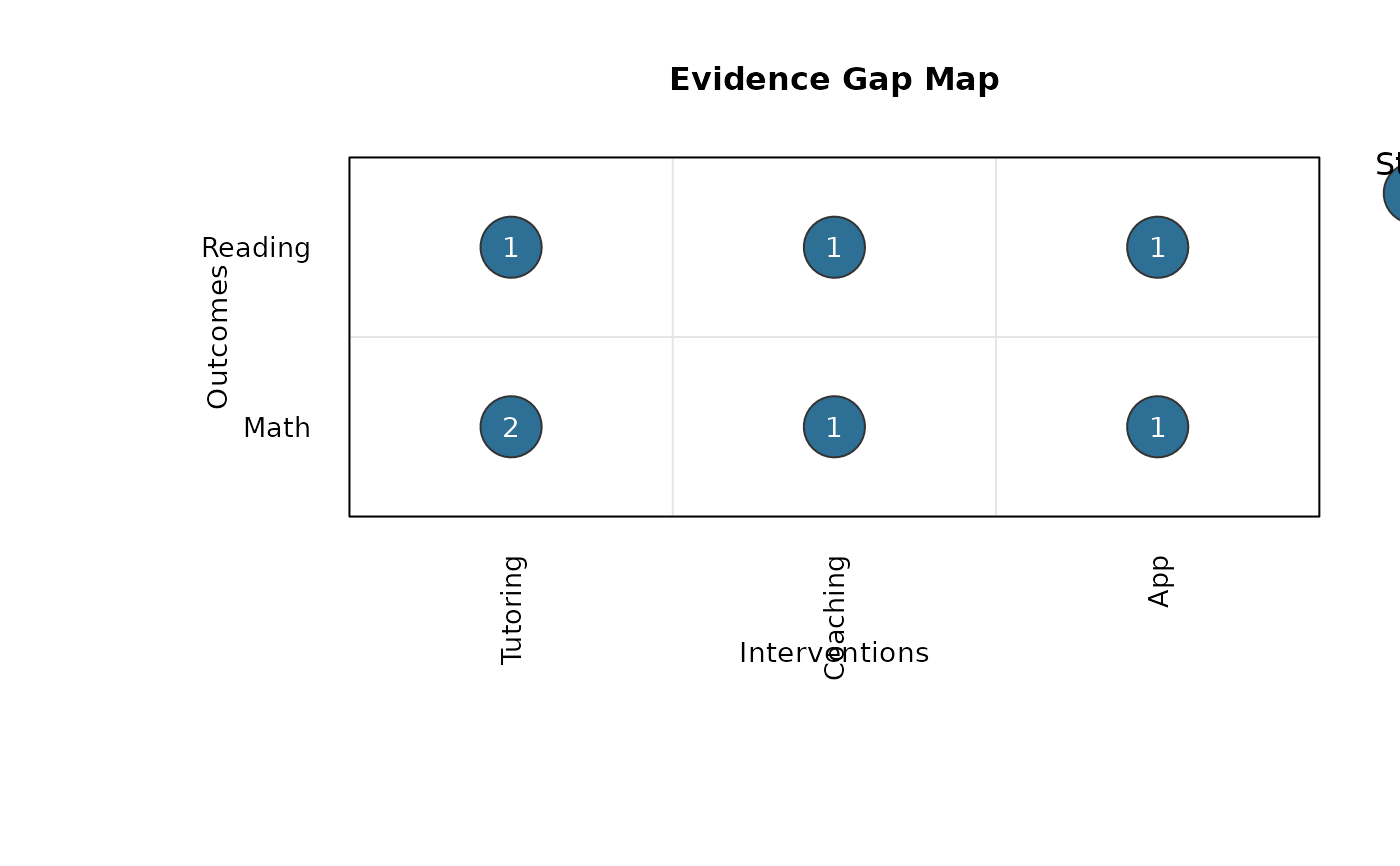 gap_map_plot(
data = gap_dat,
intervention = "intervention",
outcome = "outcome",
study_id = "study",
effect_id = "effect",
switch_axes = TRUE
)
gap_map_plot(
data = gap_dat,
intervention = "intervention",
outcome = "outcome",
study_id = "study",
effect_id = "effect",
switch_axes = TRUE
)