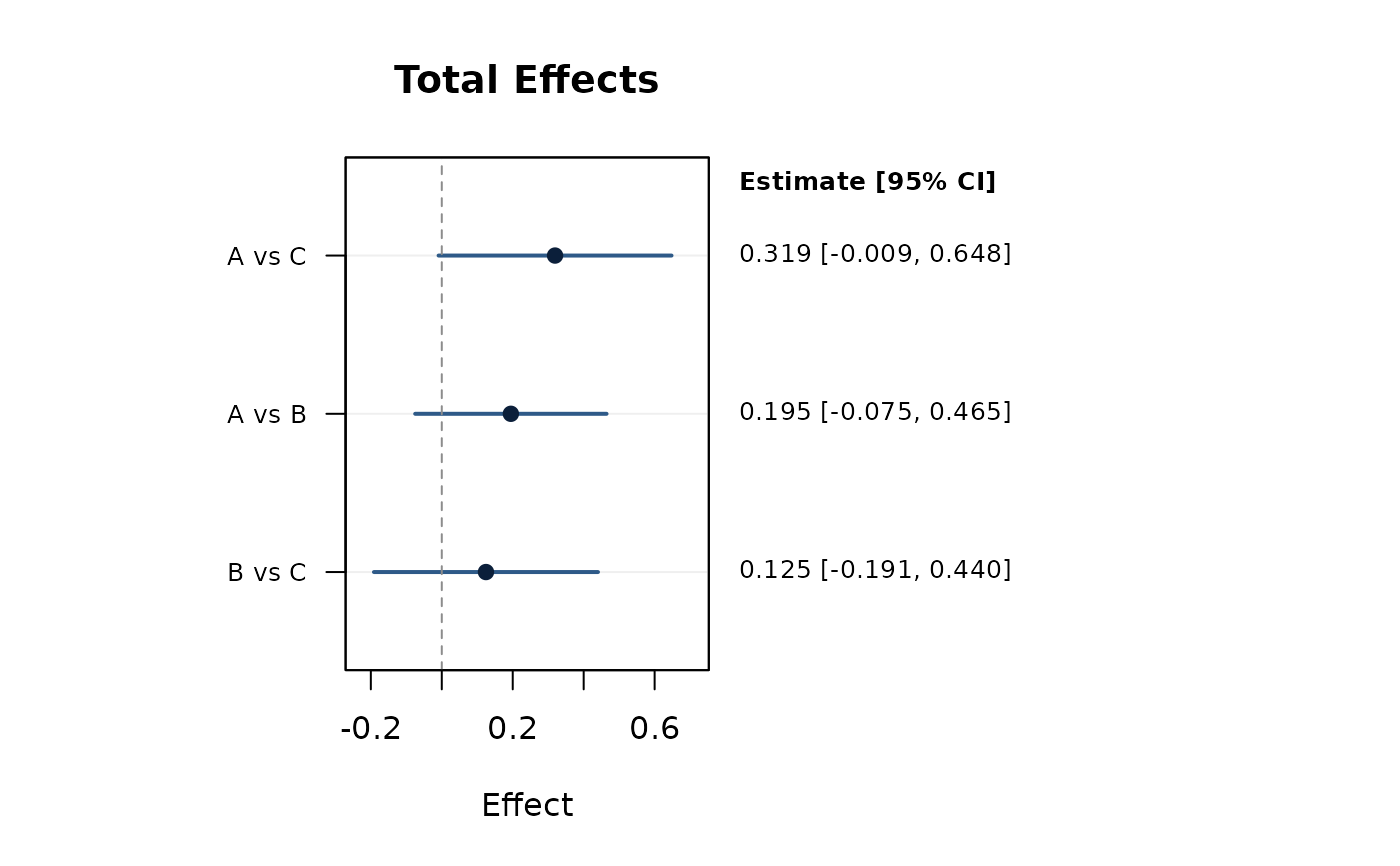
Forest Plot for Network Meta-analysis Effects
network_forest_plot.RdDraws a forest plot for one effect type from a fitted
network_meta object.
Usage
network_forest_plot(
  nma_object,
  effect_type = c("total", "direct", "indirect"),
  ci_level = 0.95,
  order_by = c("effect", "abs_effect", "comparison"),
  decreasing = FALSE,
  xlab = "Effect",
  main = NULL,
  ref_line = 0,
  point_col = "#0B1F3A",
  ci_col = "#2E5A88",
  ci_lty = 1,
  ci_lwd = 2,
  point_pch = 19,
  point_cex = 1,
  label_cex = 0.8,
  right_digits = 3,
  right_header = NULL,
  ref_col = "gray55",
  main_adj = 0.5,
  main_line = NULL
)
Arguments
- nma_object
A fitted object returned by
network_meta.- effect_type
One of
"total","direct", or"indirect".- ci_level
Confidence level for interval bounds. Defaults to
0.95.- order_by
Ordering rule for rows. One of
"effect","abs_effect", or"comparison".- decreasing
Logical; whether to reverse the selected order.
- xlab
Label for x-axis.
- main
Optional title. If
NULL, an automatic title is used.- ref_line
Vertical reference line location. Defaults to
0.- point_col
Point color.
- ci_col
Confidence interval line color.
- ci_lty
Confidence interval line type.
- ci_lwd
Confidence interval line width.
- point_pch
Point symbol.
- point_cex
Point size scaling.
- label_cex
Label size scaling.
- right_digits
Number of digits shown in right-side labels.
- right_header
Optional header shown above the right-side CI label column. If
NULL, a header is built fromci_level.- ref_col
Color of the vertical reference line.
- main_adj
Horizontal title alignment in
[0, 1].- main_line
Optional title line. If
NULL, default is used.