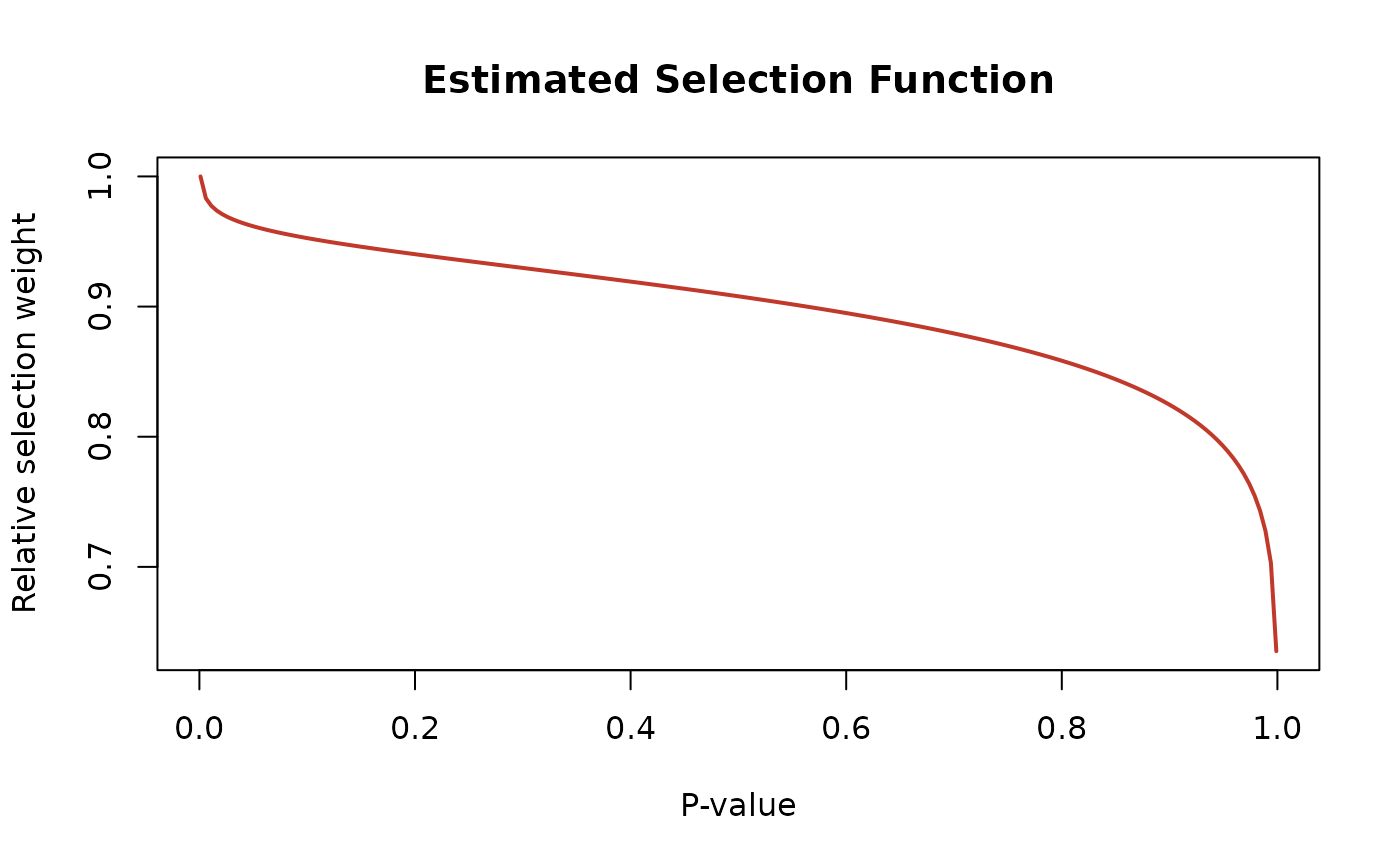
Selection-Function Plot for Publication-Bias Models
selection_plot.RdDraws the estimated selection function (selection weight versus p-value)
from a fitted pub_bias object.
Usage
selection_plot(object, ...)

# S3 method for class 'pub_bias'
selection_plot(
  object,
  normalize = TRUE,
  p_grid = seq(0.001, 0.999, length.out = 200),
  line_col = "#C0392B",
  line_lwd = 2,
  bar_col = "#F3A683",
  border_col = "#B23A2B",
  xlab = "P-value",
  ylab = NULL,
  main = "Estimated Selection Function",
  main_adj = 0.5,
  main_line = NULL,
  ...
)

# S3 method for class 'pub_bias'
plot(x, type = c("funnel", "selection"), ...)
Arguments
- object
A fitted object returned by
publication_bias.- ...
Additional arguments passed to
funnel_plot()orselection_plot().- normalize
Logical; if
TRUE, rescales weights so the largest plotted weight equals 1.- p_grid
Numeric vector of p-values where the selection function is evaluated for continuous methods.
- line_col
Line color used for continuous selection models.
- line_lwd
Line width used for continuous selection models.
- bar_col
Fill color used for bin bars when
method = "beta_binomial".- border_col
Border color for bin bars.
- xlab
X-axis label.
- ylab
Optional y-axis label.
- main
Plot title.
- main_adj
Horizontal title alignment in
[0, 1].- main_line
Optional title line. If
NULL, default is used.- x
A fitted object returned by
publication_bias().- type
Plot type:
"funnel"or"selection".
Examples
# \donttest{
fit <- mars(
  data = teacher_expectancy,
  studyID = "study",
  effectID = NULL,
  sample_size = NULL,
  formula = yi ~ 1,
  variance = "vi",
  varcov_type = "univariate",
  structure = "univariate"
)
bias_fit <- publication_bias(fit)
selection_plot(bias_fit)

# }
# }